The point of this note is to introduce readers to my process for analyzing volatility markets to express macro trades. My process involves conducting macro research on a continuous basis, then using the options markets to exploit where I think there are asymmetric opportunities.
Nothing I write should constitute investment advice. Every person has their own particular financial situation, objectives and risk tolerances. Thus, I am not trying to create portfolios for you. What I am trying to do is provide my framework, which can hopefully assist you in navigating markets.
Options trading is complex, mathematical and requires making quick decisions on a regular basis. If you have trouble thinking non linearly, or find these topics too complex for you, then perhaps a more linear style of investing is a better framework for you. If you do enjoy this note and options trading is something you feel comfortable with, then please subscribe as I will subsequently post my detailed macro notes and trade ideas behind the paywall. Let’s get started.
There are a variety of ways to trade options. Let’s review some, but not all of them.
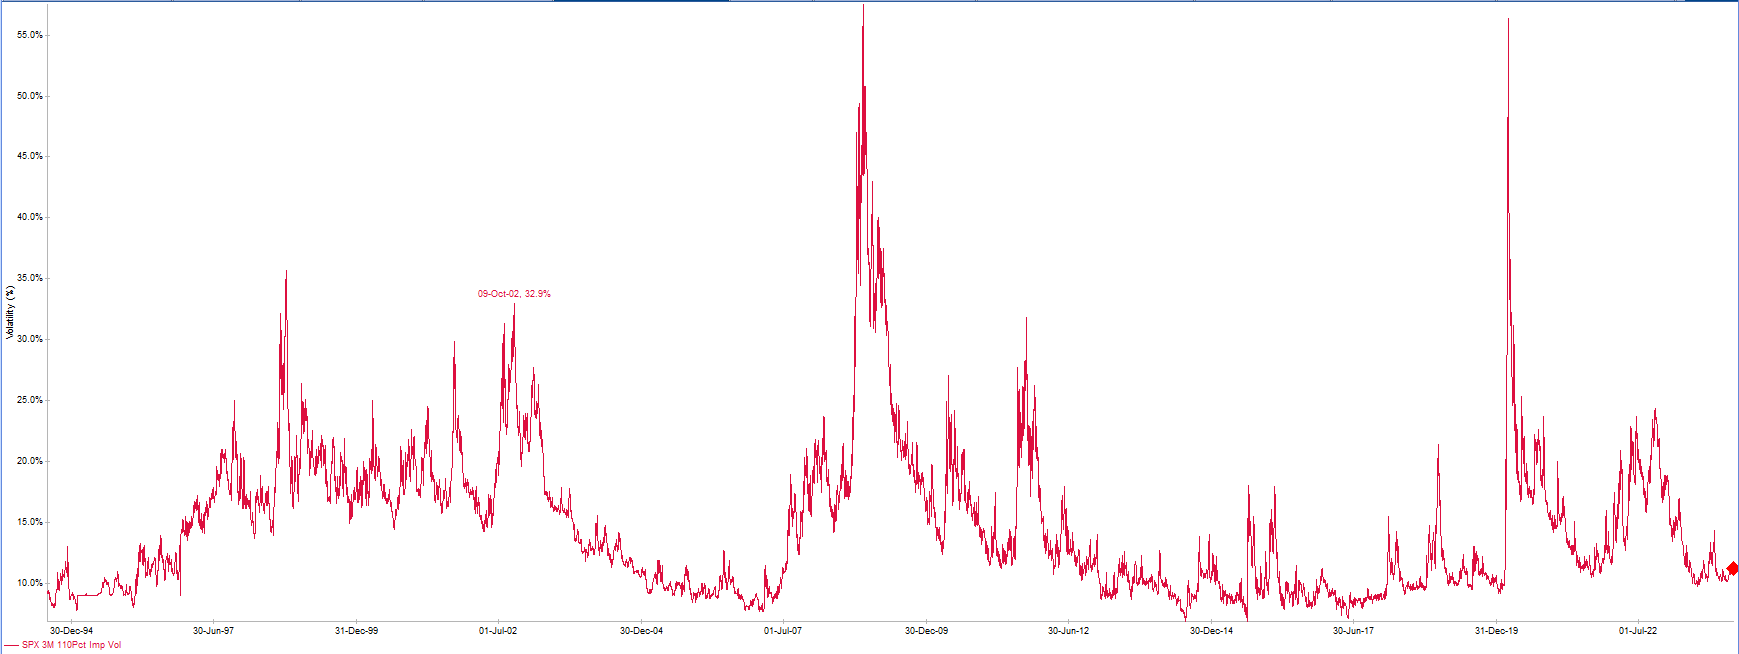
Directional trades. This is the vast majority of options trading. Investors in this case buy calls or puts to express a directional view on a market. When I express directional trades, I look at implied volatility as a tool to express the view. It can either contribute or negate some of the PnL you generate if the move is correct. Thus, it’s important to look at the level of implied vol (is it low or high relative to history) and the directionality of vol (does it rise in declining market or rising market) in order to know if it is a headwind or a tailwind to a trade. Analysis for this type of trading is simple: buy cheap vol, or sell rich vol. A couple rules of thumb: buying OTM options brings more asymmetric upside if you get the direction and move right, and I always recommend buying a maturity longer than the time horizon you are expecting (example: if you think a selloff is imminent, it is tempting to buy a 0DTE or 1 week option, but I would actually recommend a 2week or 1 month trade as it gives you more staying power if you are early. Below is a chart of 3month SPX 110% vol, which looks pretty cheap if you want to express a bullish view on the market.

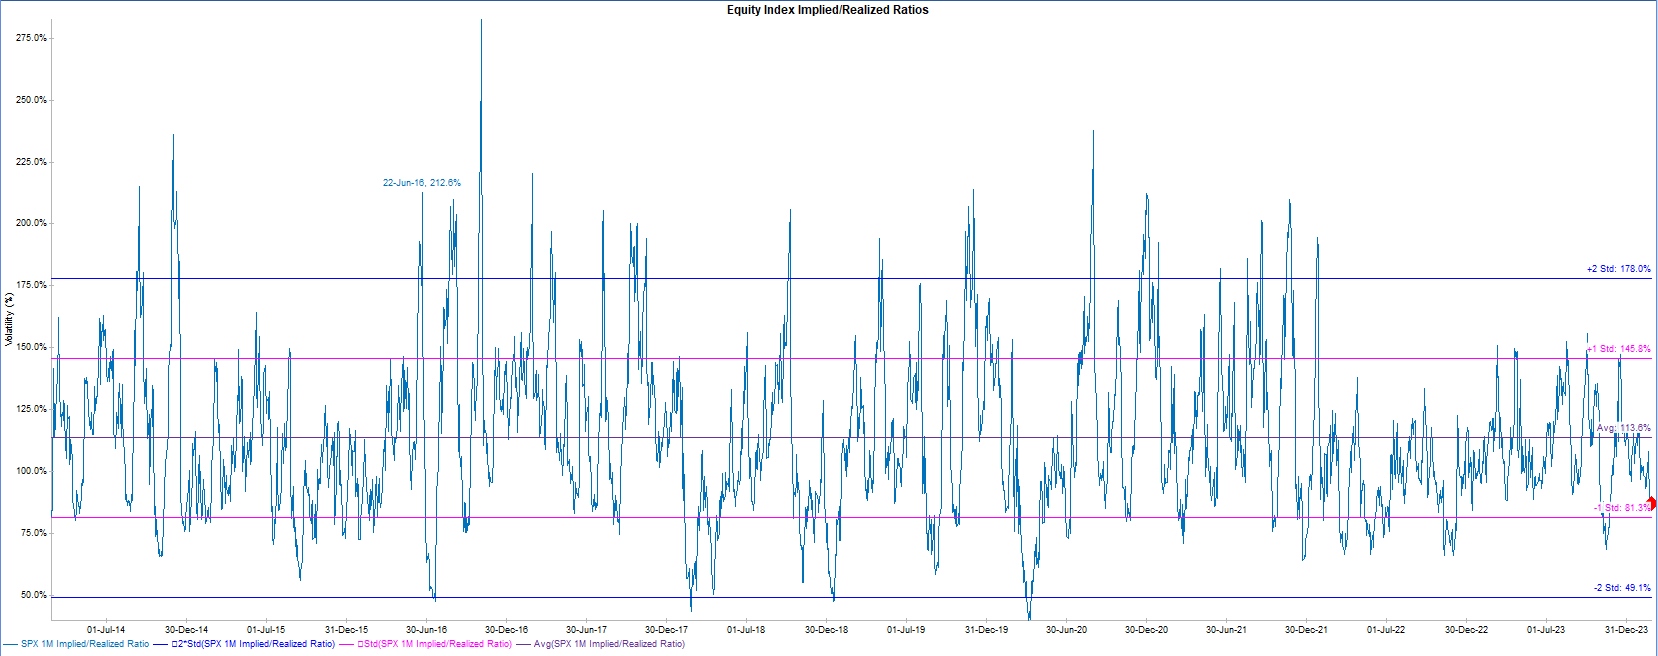
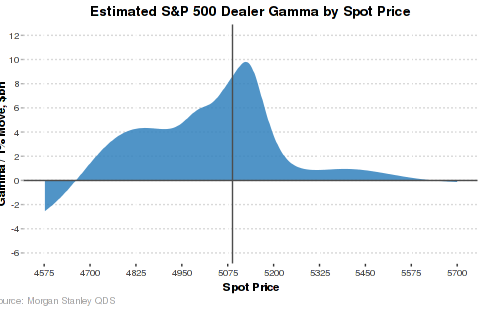
Gamma Scalping. This is a very different approach than directional trading. In this case, option traders are trading the implied/realized ratio of volatility. This is how market makers trade. They do not take directional risk; their job is to take volatility risk. Thus, they are actively hedging their positions to return to a delta neutral position. Below is a chart of 1M implied/realized vol ratio. As shown, implied is typically larger than realized, so it doesn’t usually pay well to be long options expecting large daily moves. In most cases, being short volatility makes sense as long as realized volatility comes in lower than what was implied for the day (it is called earning theta). When the ratio is below 100% as it is now, it is a good deal to buy options and hedge daily once the market moves beyond your breakeven point. The breakeven point is calculated as: (implied volatility)/sqrt(252). Thus, if implied vol is 11.6%, the daily breakeven is 0.73%/day. If you are long, you want a move larger than this before you hedge. If you are short, you are hoping the market delivers smaller moves. Since we know that market makers do not take directional risk, we often want to know what their net gamma position is. That is because if we know they are long gamma, we know they will moderate the market; they will sell rallies and they will buy dips as they hedge their portfolios. If they are short gamma, then we know moves can cascade on each other.