

Is the labor market cracking? The market reaction on Friday was pure panic after the report that was weak overall. Hiring stepped down from 179k (which was 206k prior to a revision) to 114k, soft wage growth and a notable upside move in the unemployment rate, which has steadily risen as shown below. The concern is that this is a rapid weakening and that recession odds are rising fast and the Fed is being the curve and should urgently cut.
I decided to dig into this report and the overall state of the labor market.
There are indeed some signs of softening that have been evident for months. While the unemployment is at a very strong level historically, it has risen from 3.9% to 4.3% since April.

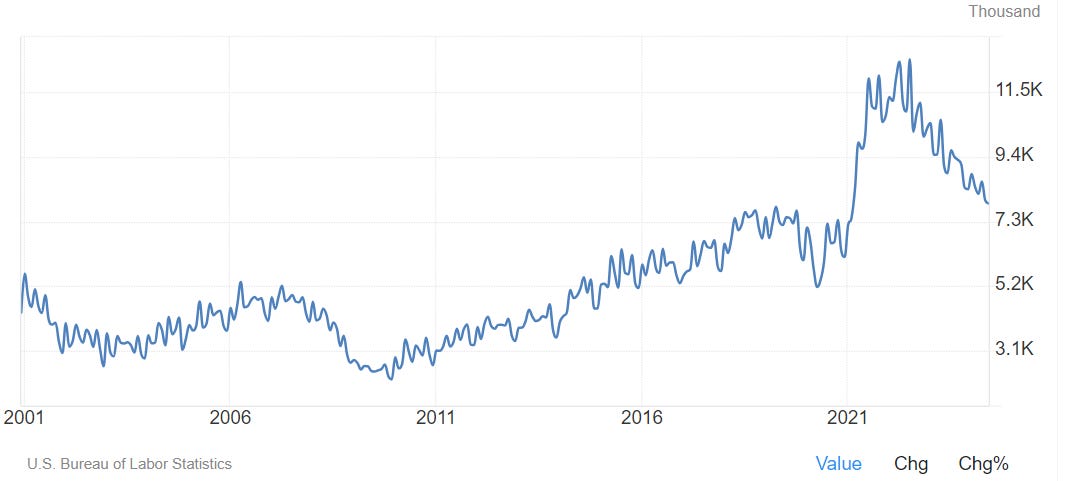
Job openings have steadily declined, although both outright and as a ratio to unemployed they are still above pre-covid and at strong historical levels.
The lower level of job openings has been a move down the Beveridge curve thus far, and the concern is a further move down will shift us to the right, and result in a much higher level of unemployment quickly. Since the unemployment rate has risen, the concern is that the labor market is already at such a stage, and perhaps job openings are stale or simply placeholders without the intent of actual hiring.

Of course, although we have been printing jobs consistently, we have seen headline job growth gradually slow.
Wage growth, shown as ECI QoQ% has moved steadily lower since 2022, although the most recent downside surprise looks to be due to a particular incentive pay situation for constructive workers. More on this sector in a bit.
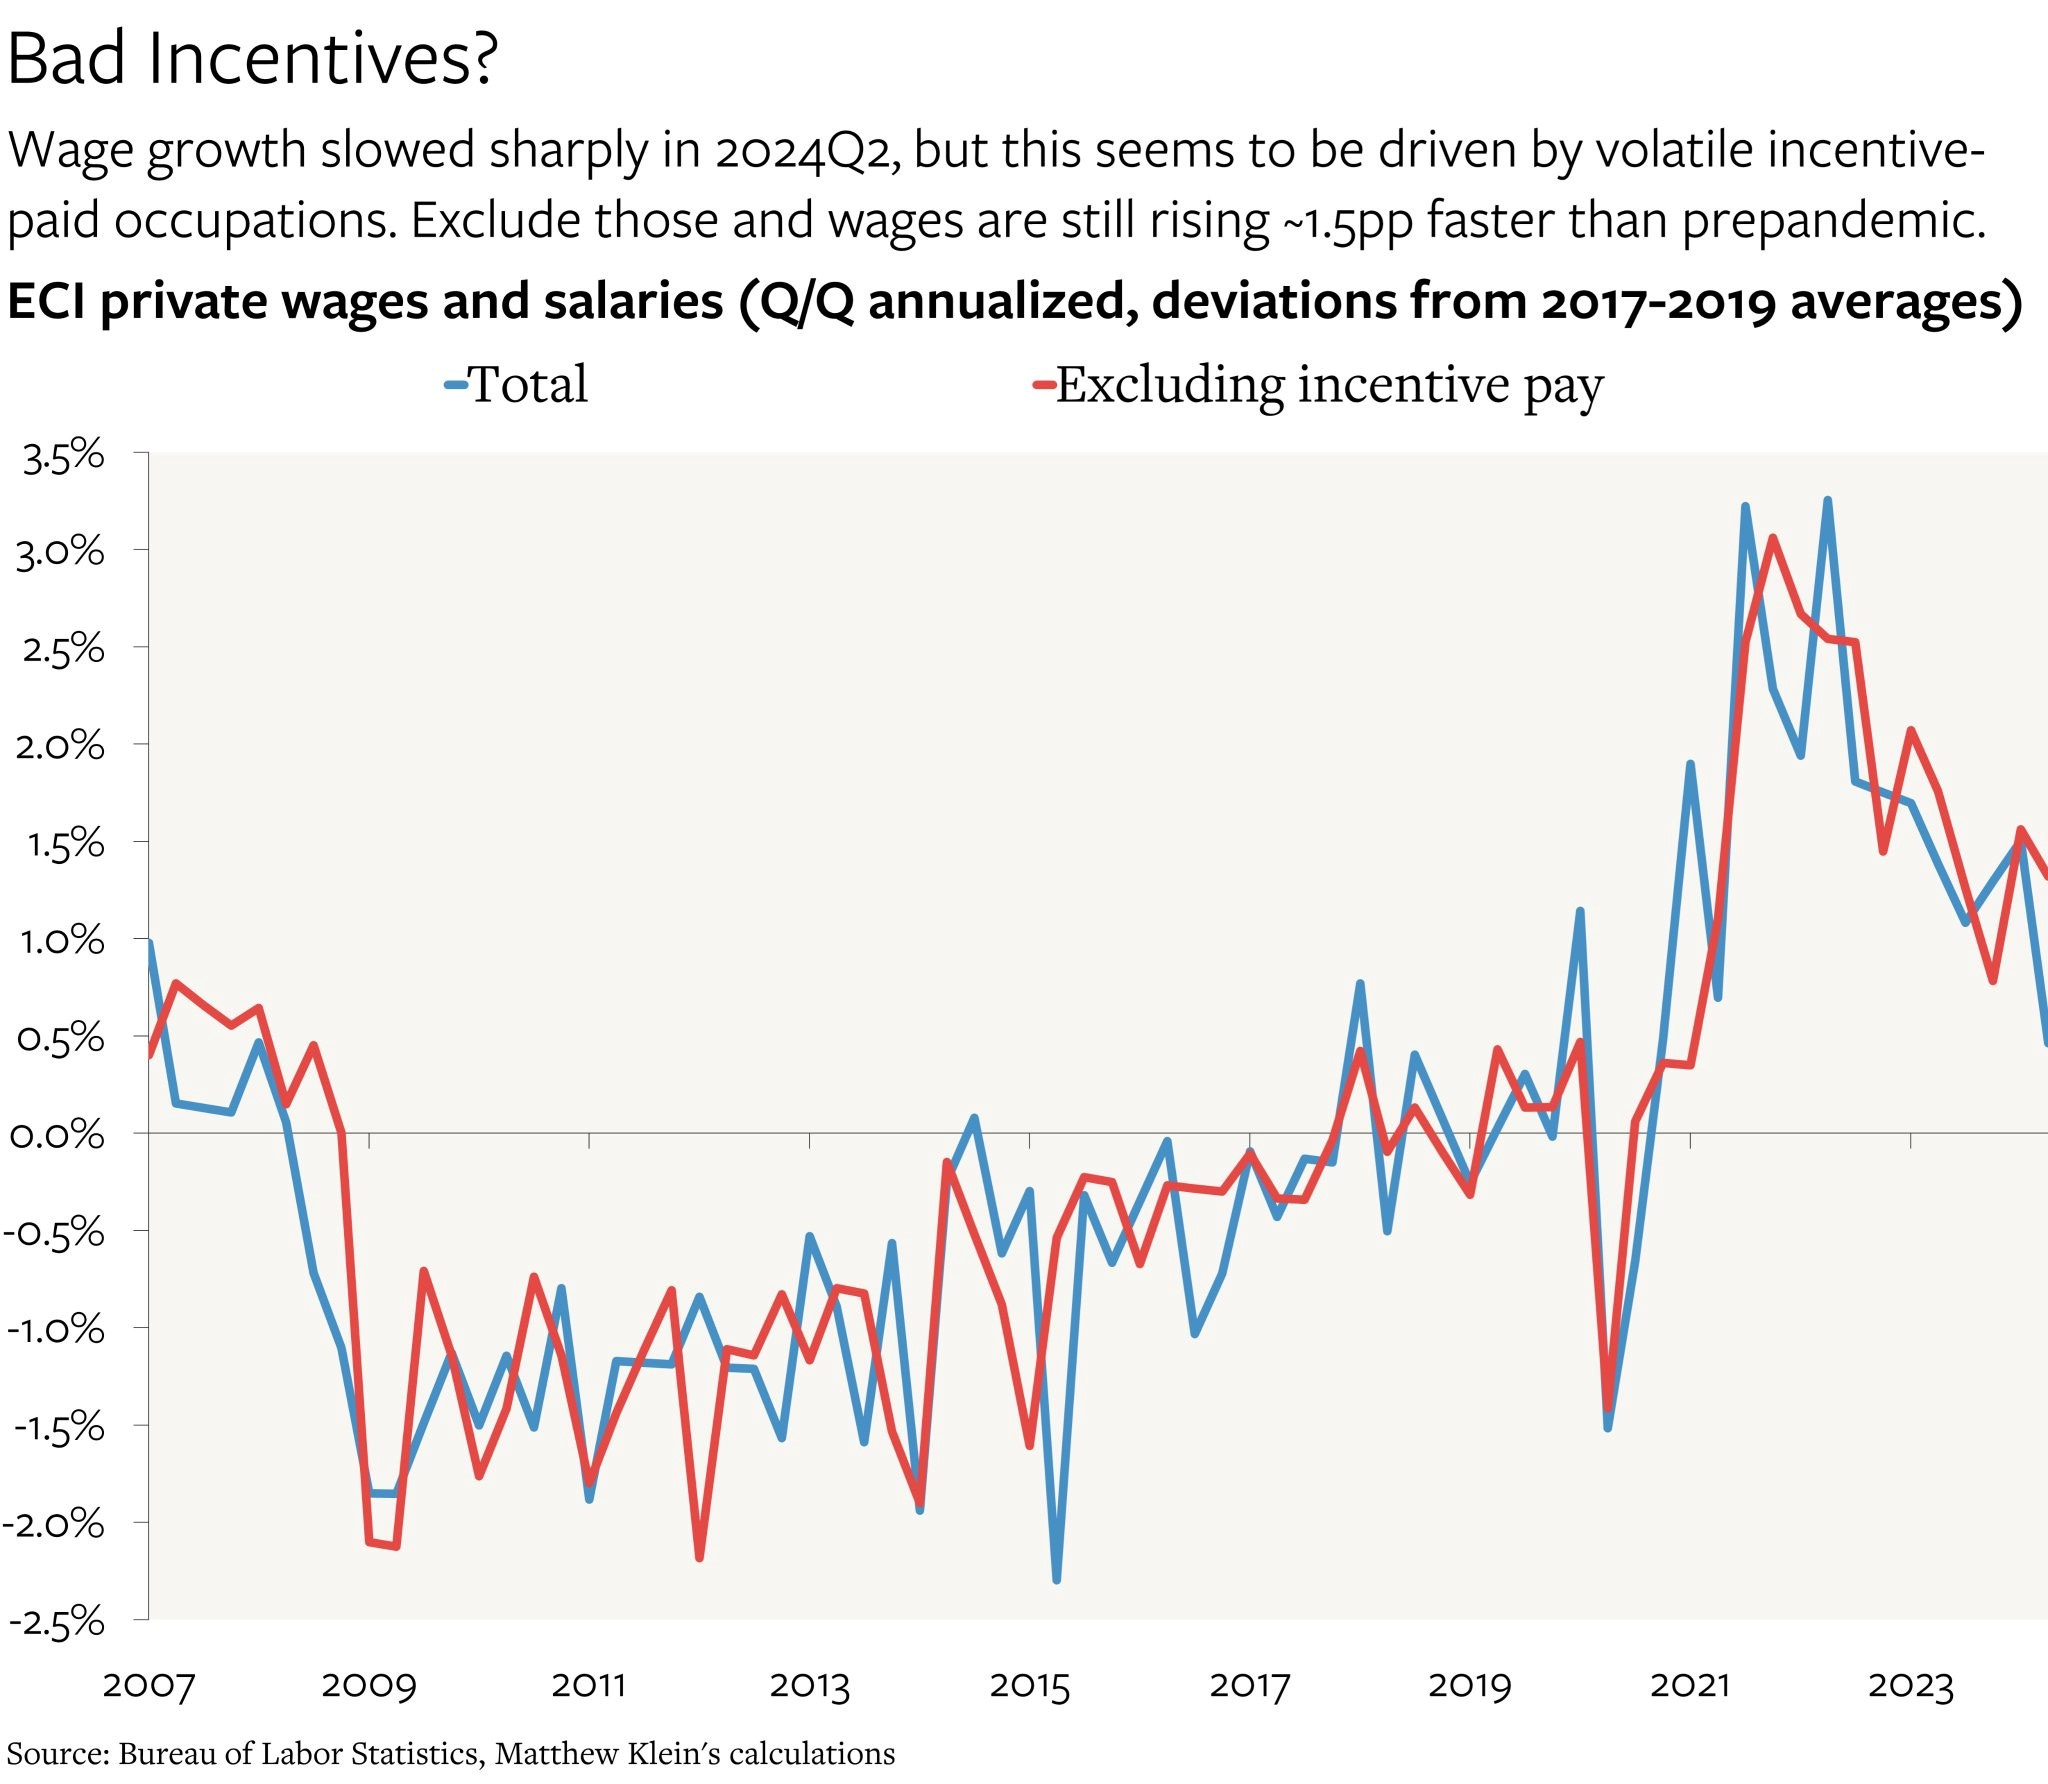
I’ve put a star where the ECI would have been without the incentive pay, and it actually looks like there’s been very little deceleration since early 2023. So this seems to be a false alarm.

So there is some softening when looking at the above charts except for the ECI, which seems quite stable and strong at 4% YoY pace.
Something hasn’t been sitting right with me, which is why I did not simply take the reported data at face value. When there are conflicting messages, you have to dig in, which I do below.
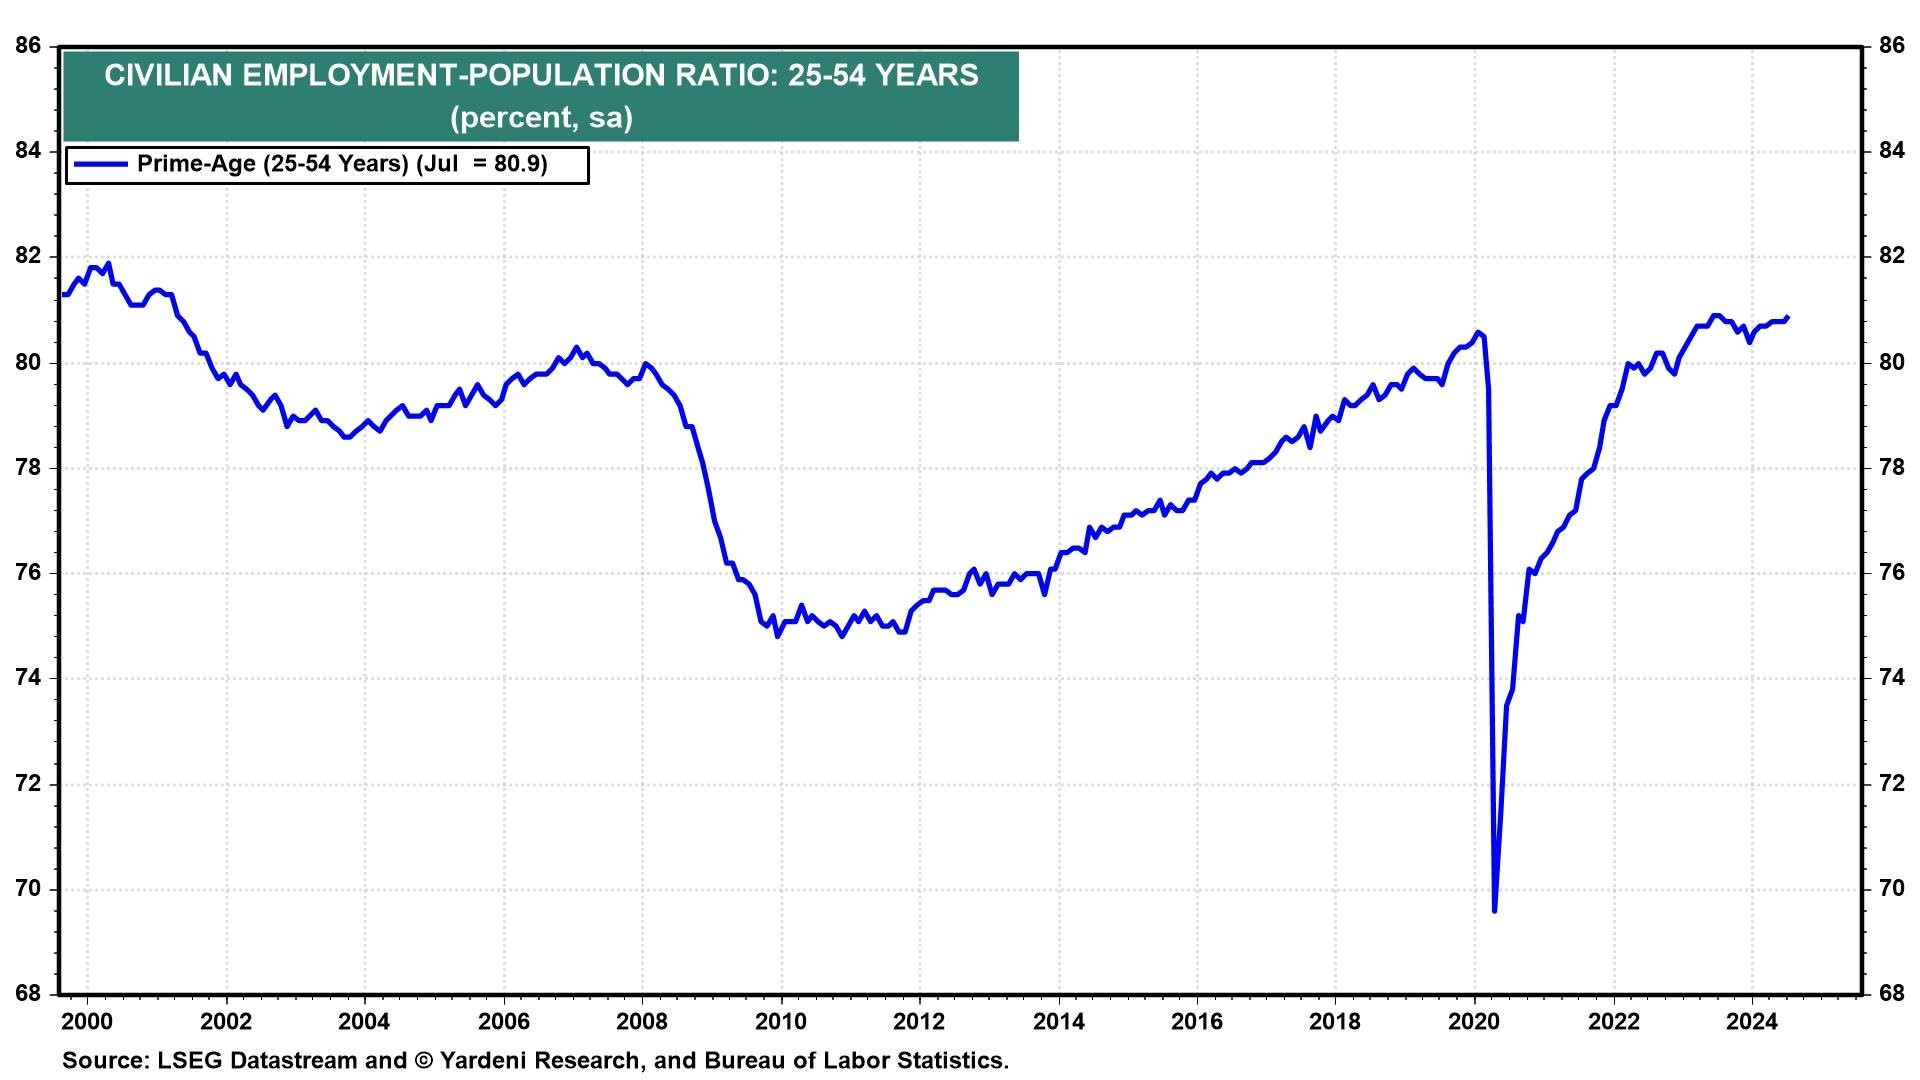
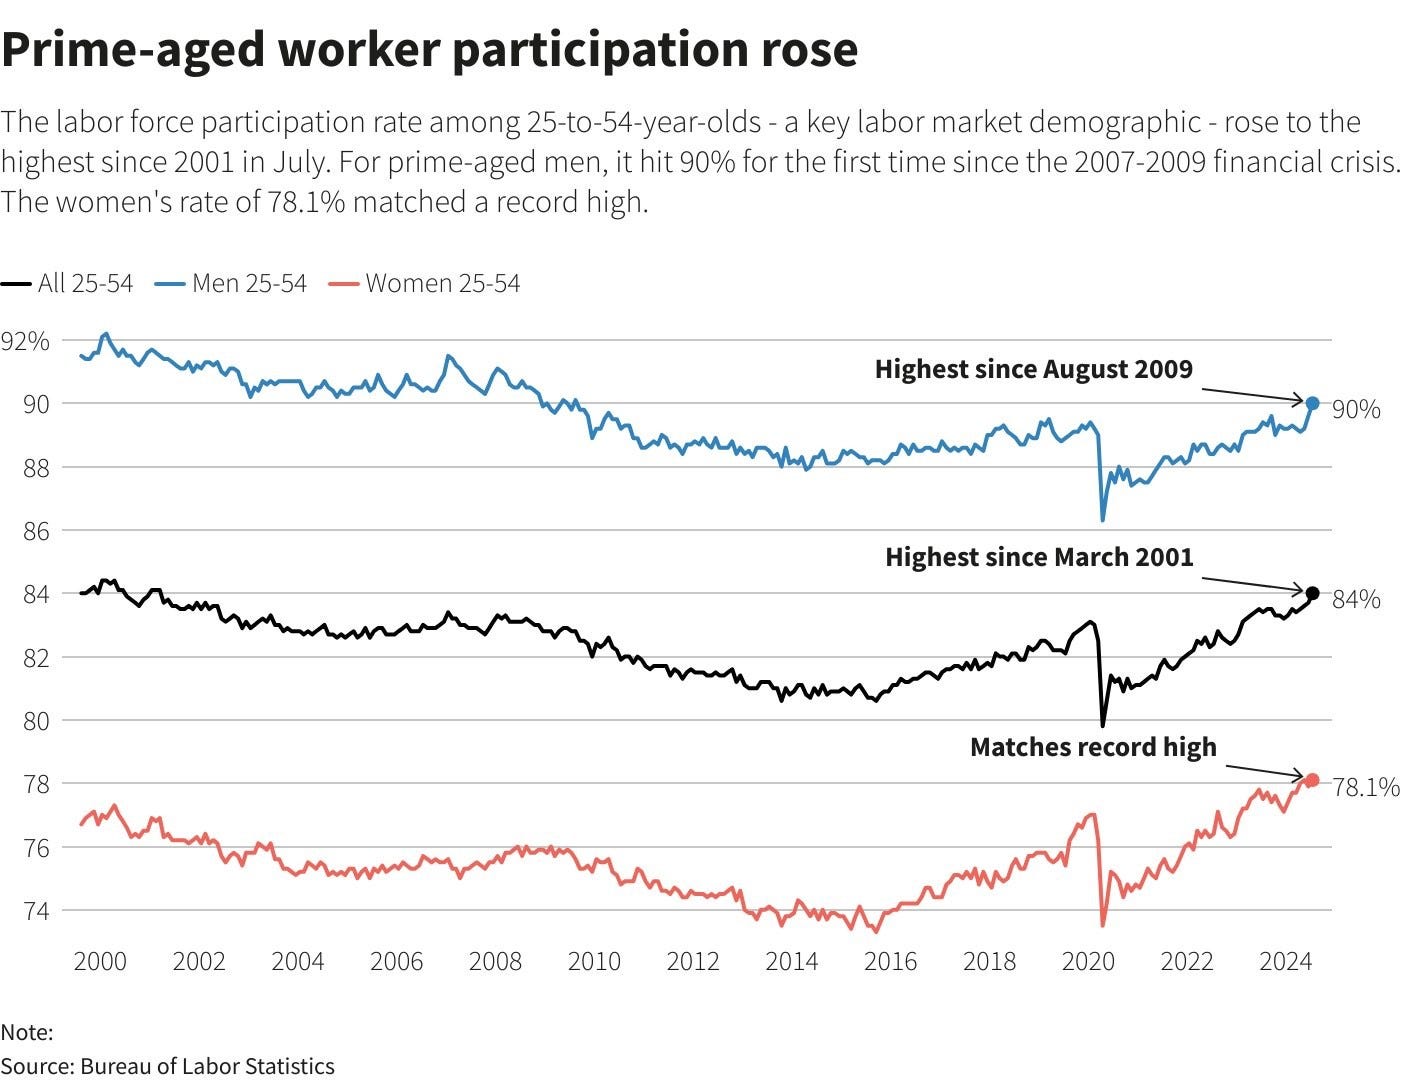
The prime age employment to population ratio has shown zero deterioration. In fact, it made a new cycle high and is at the highest level since 2001. This is reassuring.
The participation rate for both men and women of prime age are at cycle highs and many year highs as well and both improved in this report. Our prime age workers want to work and they seem to be employed at the highest levels in decades. That is a sign of a tight labor market, not loose!
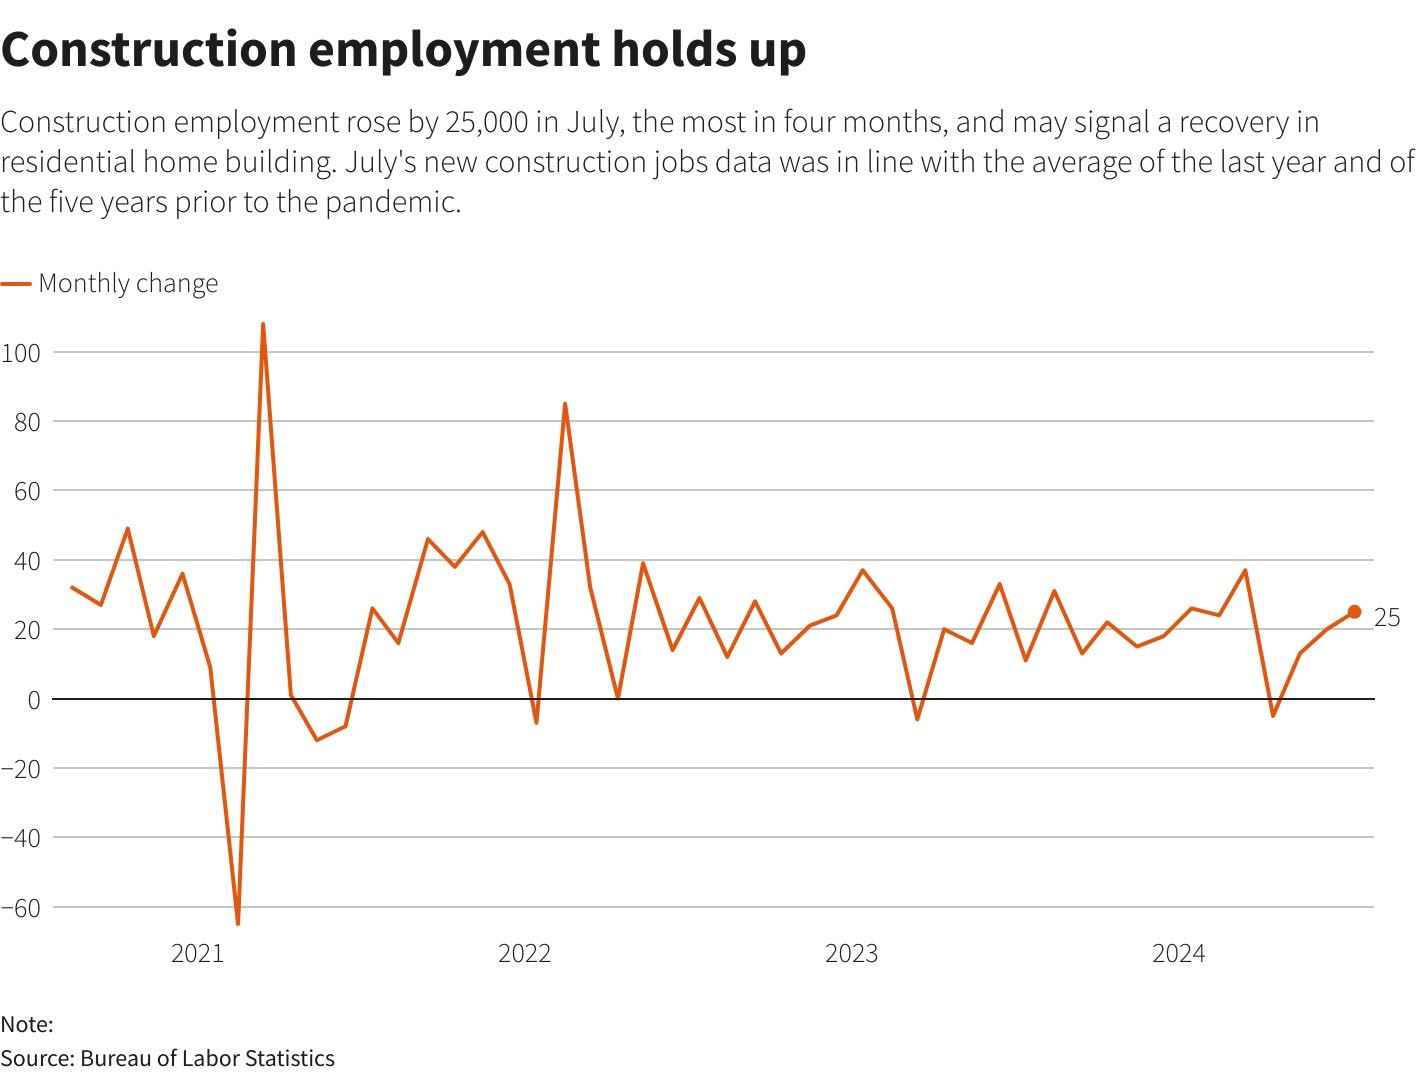
The most cyclically sensitive market is the residential real estate market, and construction employment just hit a new cycle high.
That’s even more good news because the concern was recent soft housing data would tip this sector over, and we did see a softer print last month, but we just bounced to the highest level since Q1 and near the average monthly rate since mid 2022. No deterioration seen here.
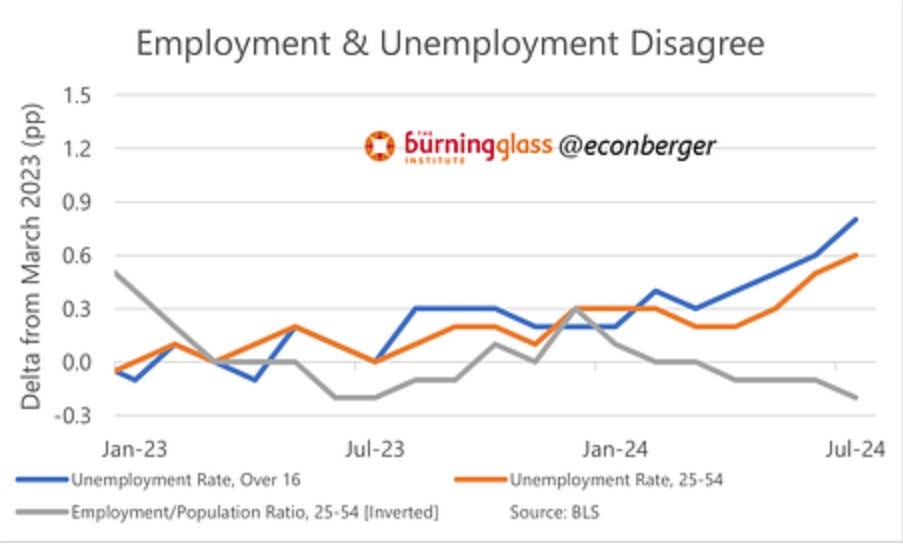
How can we have an improving prime age employment ratio and a rising unemployment rate? Guy Berger has been asking this question the last few months, and answers have not yet become apparent. Guy did note that the behavior is completely different than what we saw in the leadup to the 2007 and 2001 recessions. You saw deterioration in both measures in those cases.
Interestingly, we can look at the period from 1965-1970, which was also characterized by large immigration. The relationship seems to have broken down in that period as well. Thus, this is comforting that we have a comparable period to see such a dynamic which makes it less anomalous than we thought.

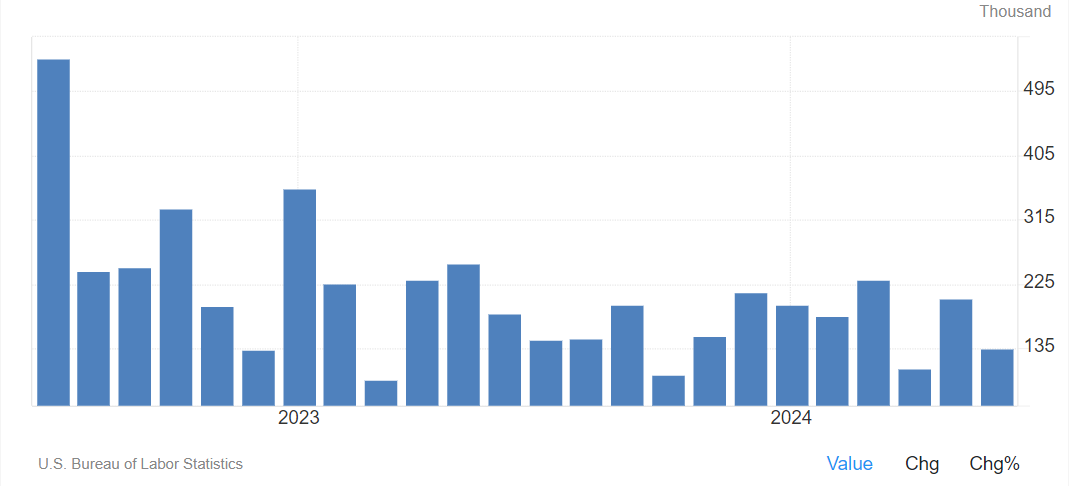
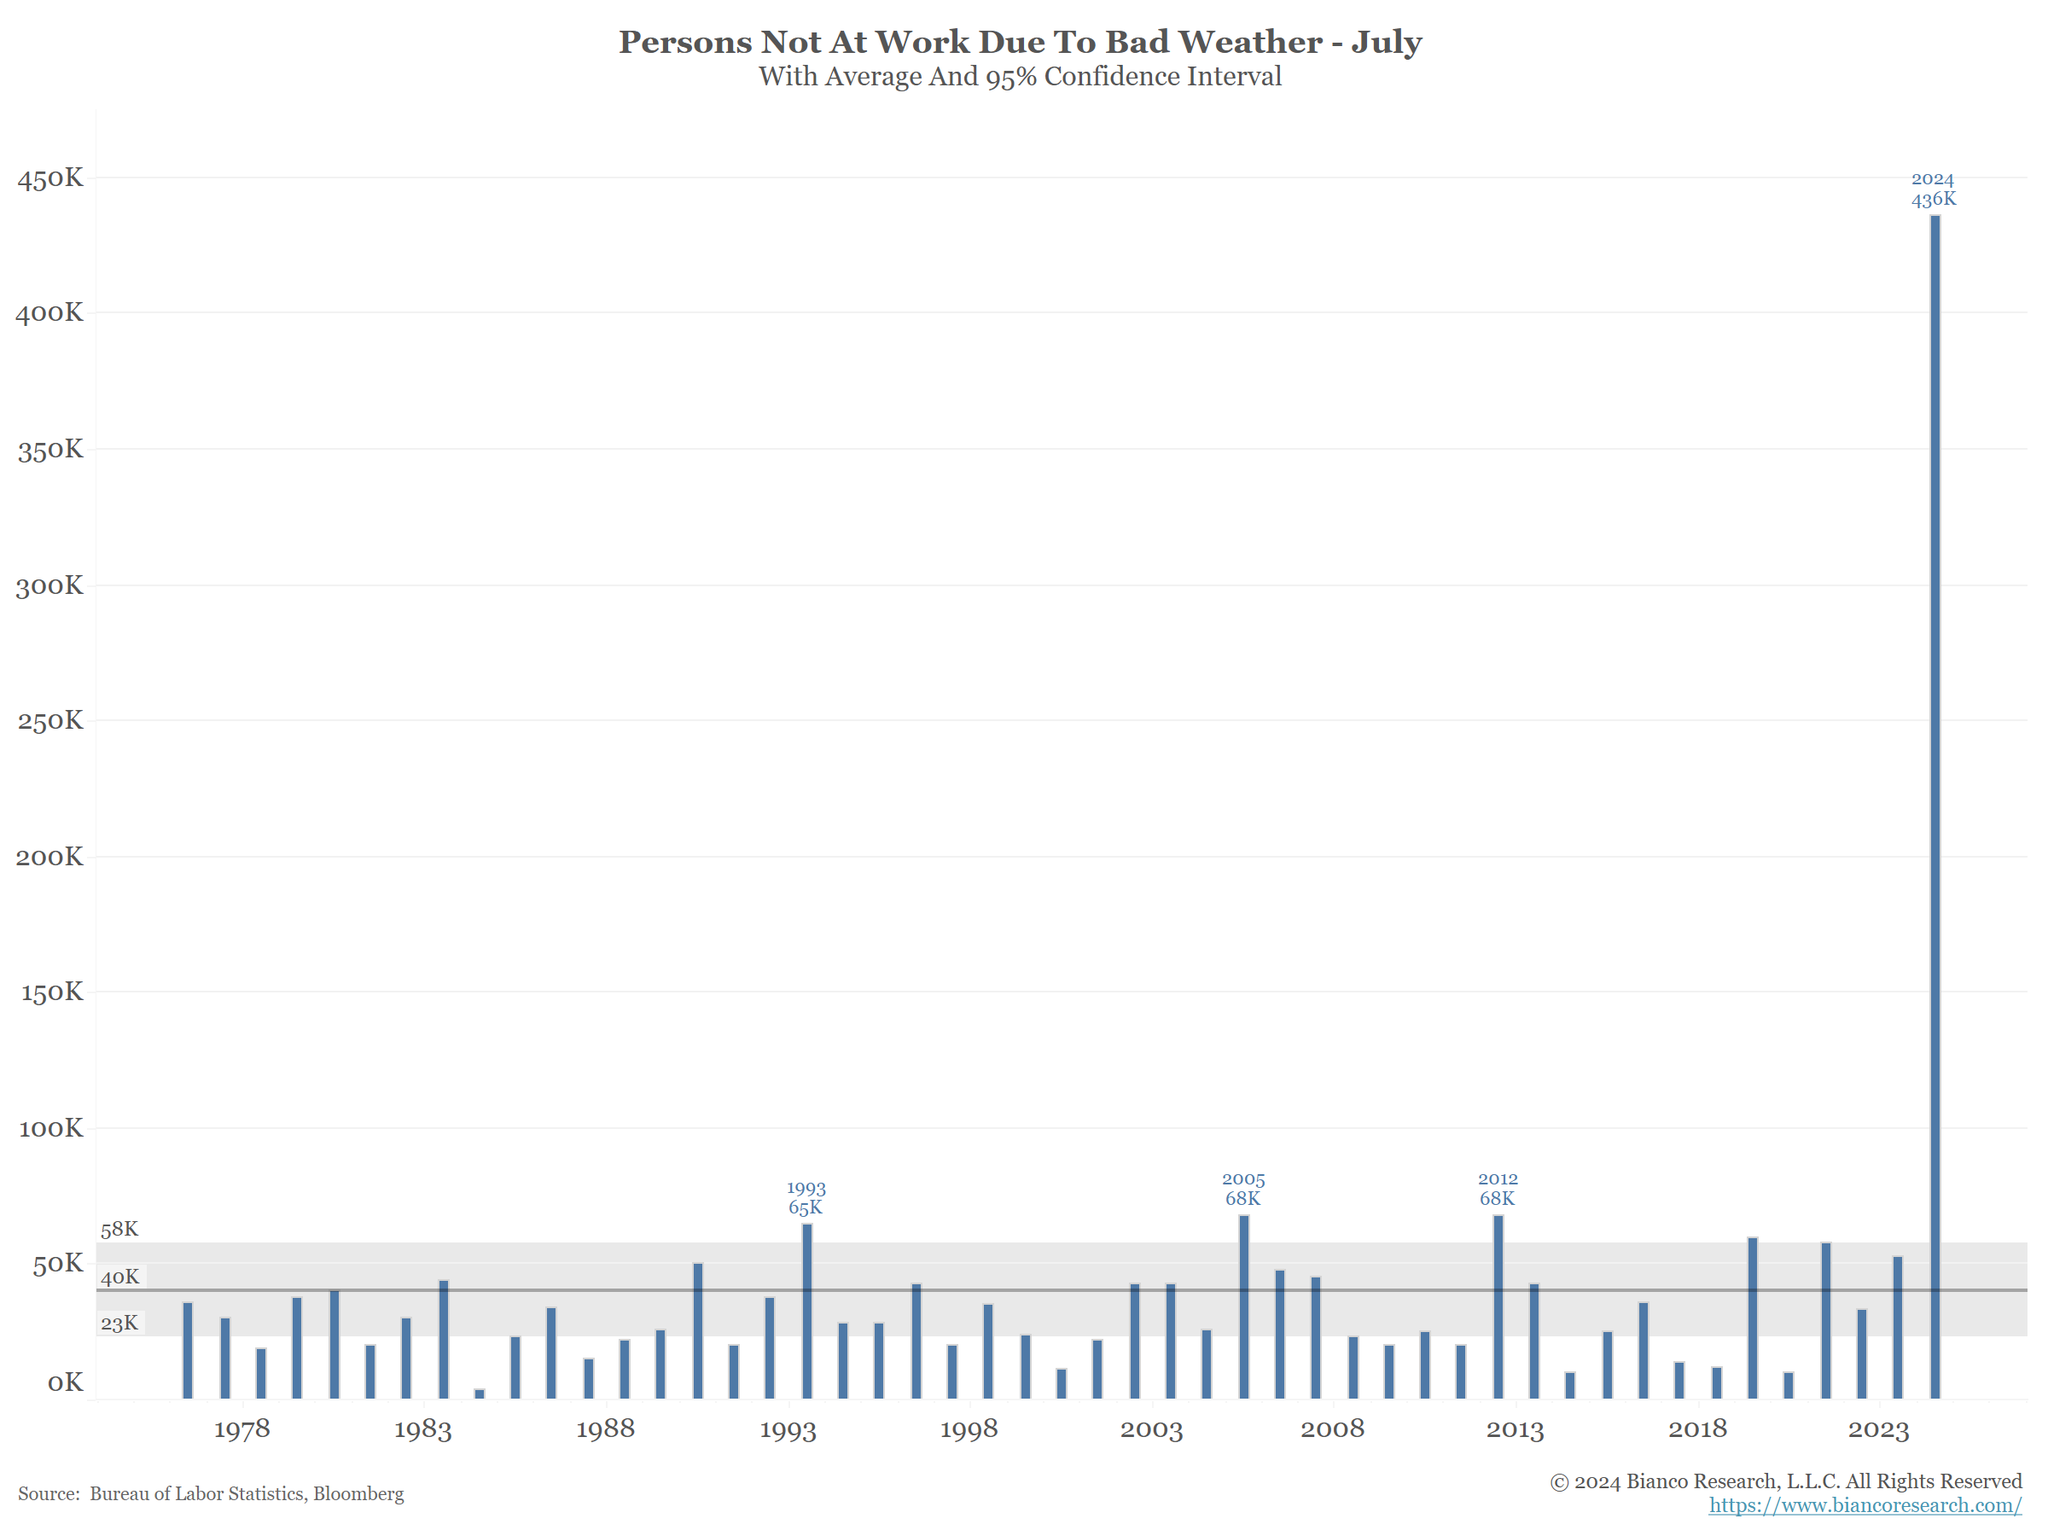
In the most recent report, which missed expectations by 65k, there have been questions if the number was impacted by the hurricane in Texas that caused many to lose power for a few days. The below chart shows an astronomical increase for the July month which shows that the weather certainly was an impact here. Let’s see if that’s true.
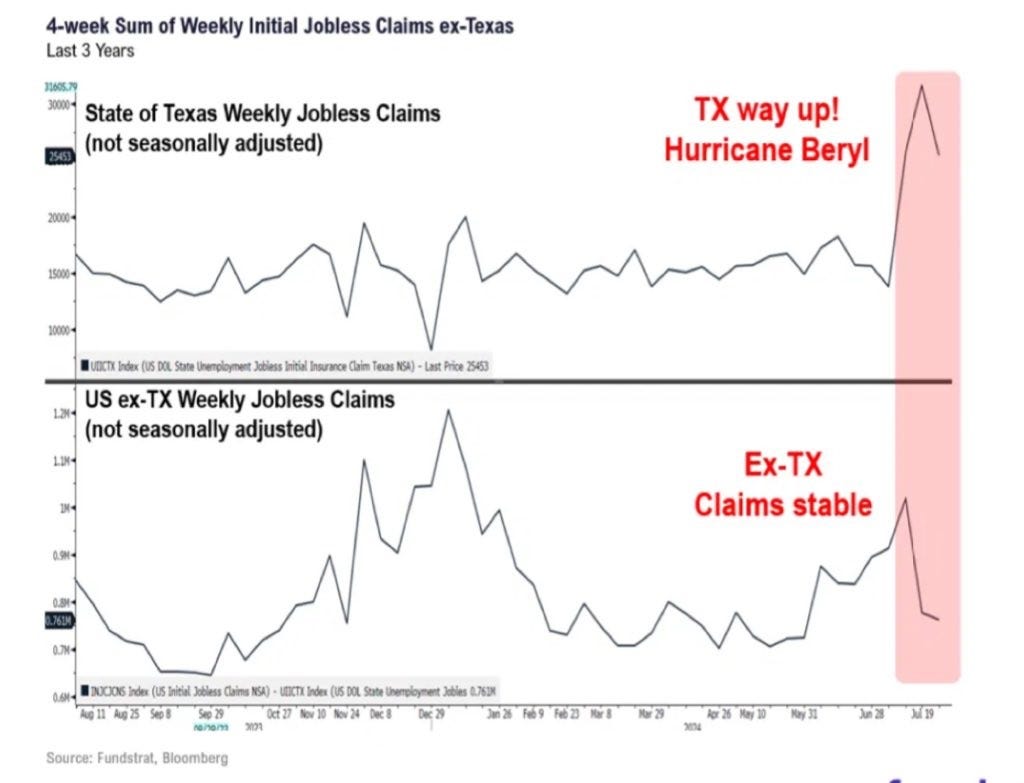
A confirmation that the labor situation was specific to Texas and the Hurricane is the behavior of jobless claims over the reporting week. Clearly, the Texas surge was not matched nationally.
The unemployment rate is calculated from the household survey. Within there, we can see a big increase in temporary layoffs, which seems to be how those affected by the hurricane reported themselves. Thus, yes it did impact the unemployment rate for this month. That’s a relief as it was a large 0.2% move higher.

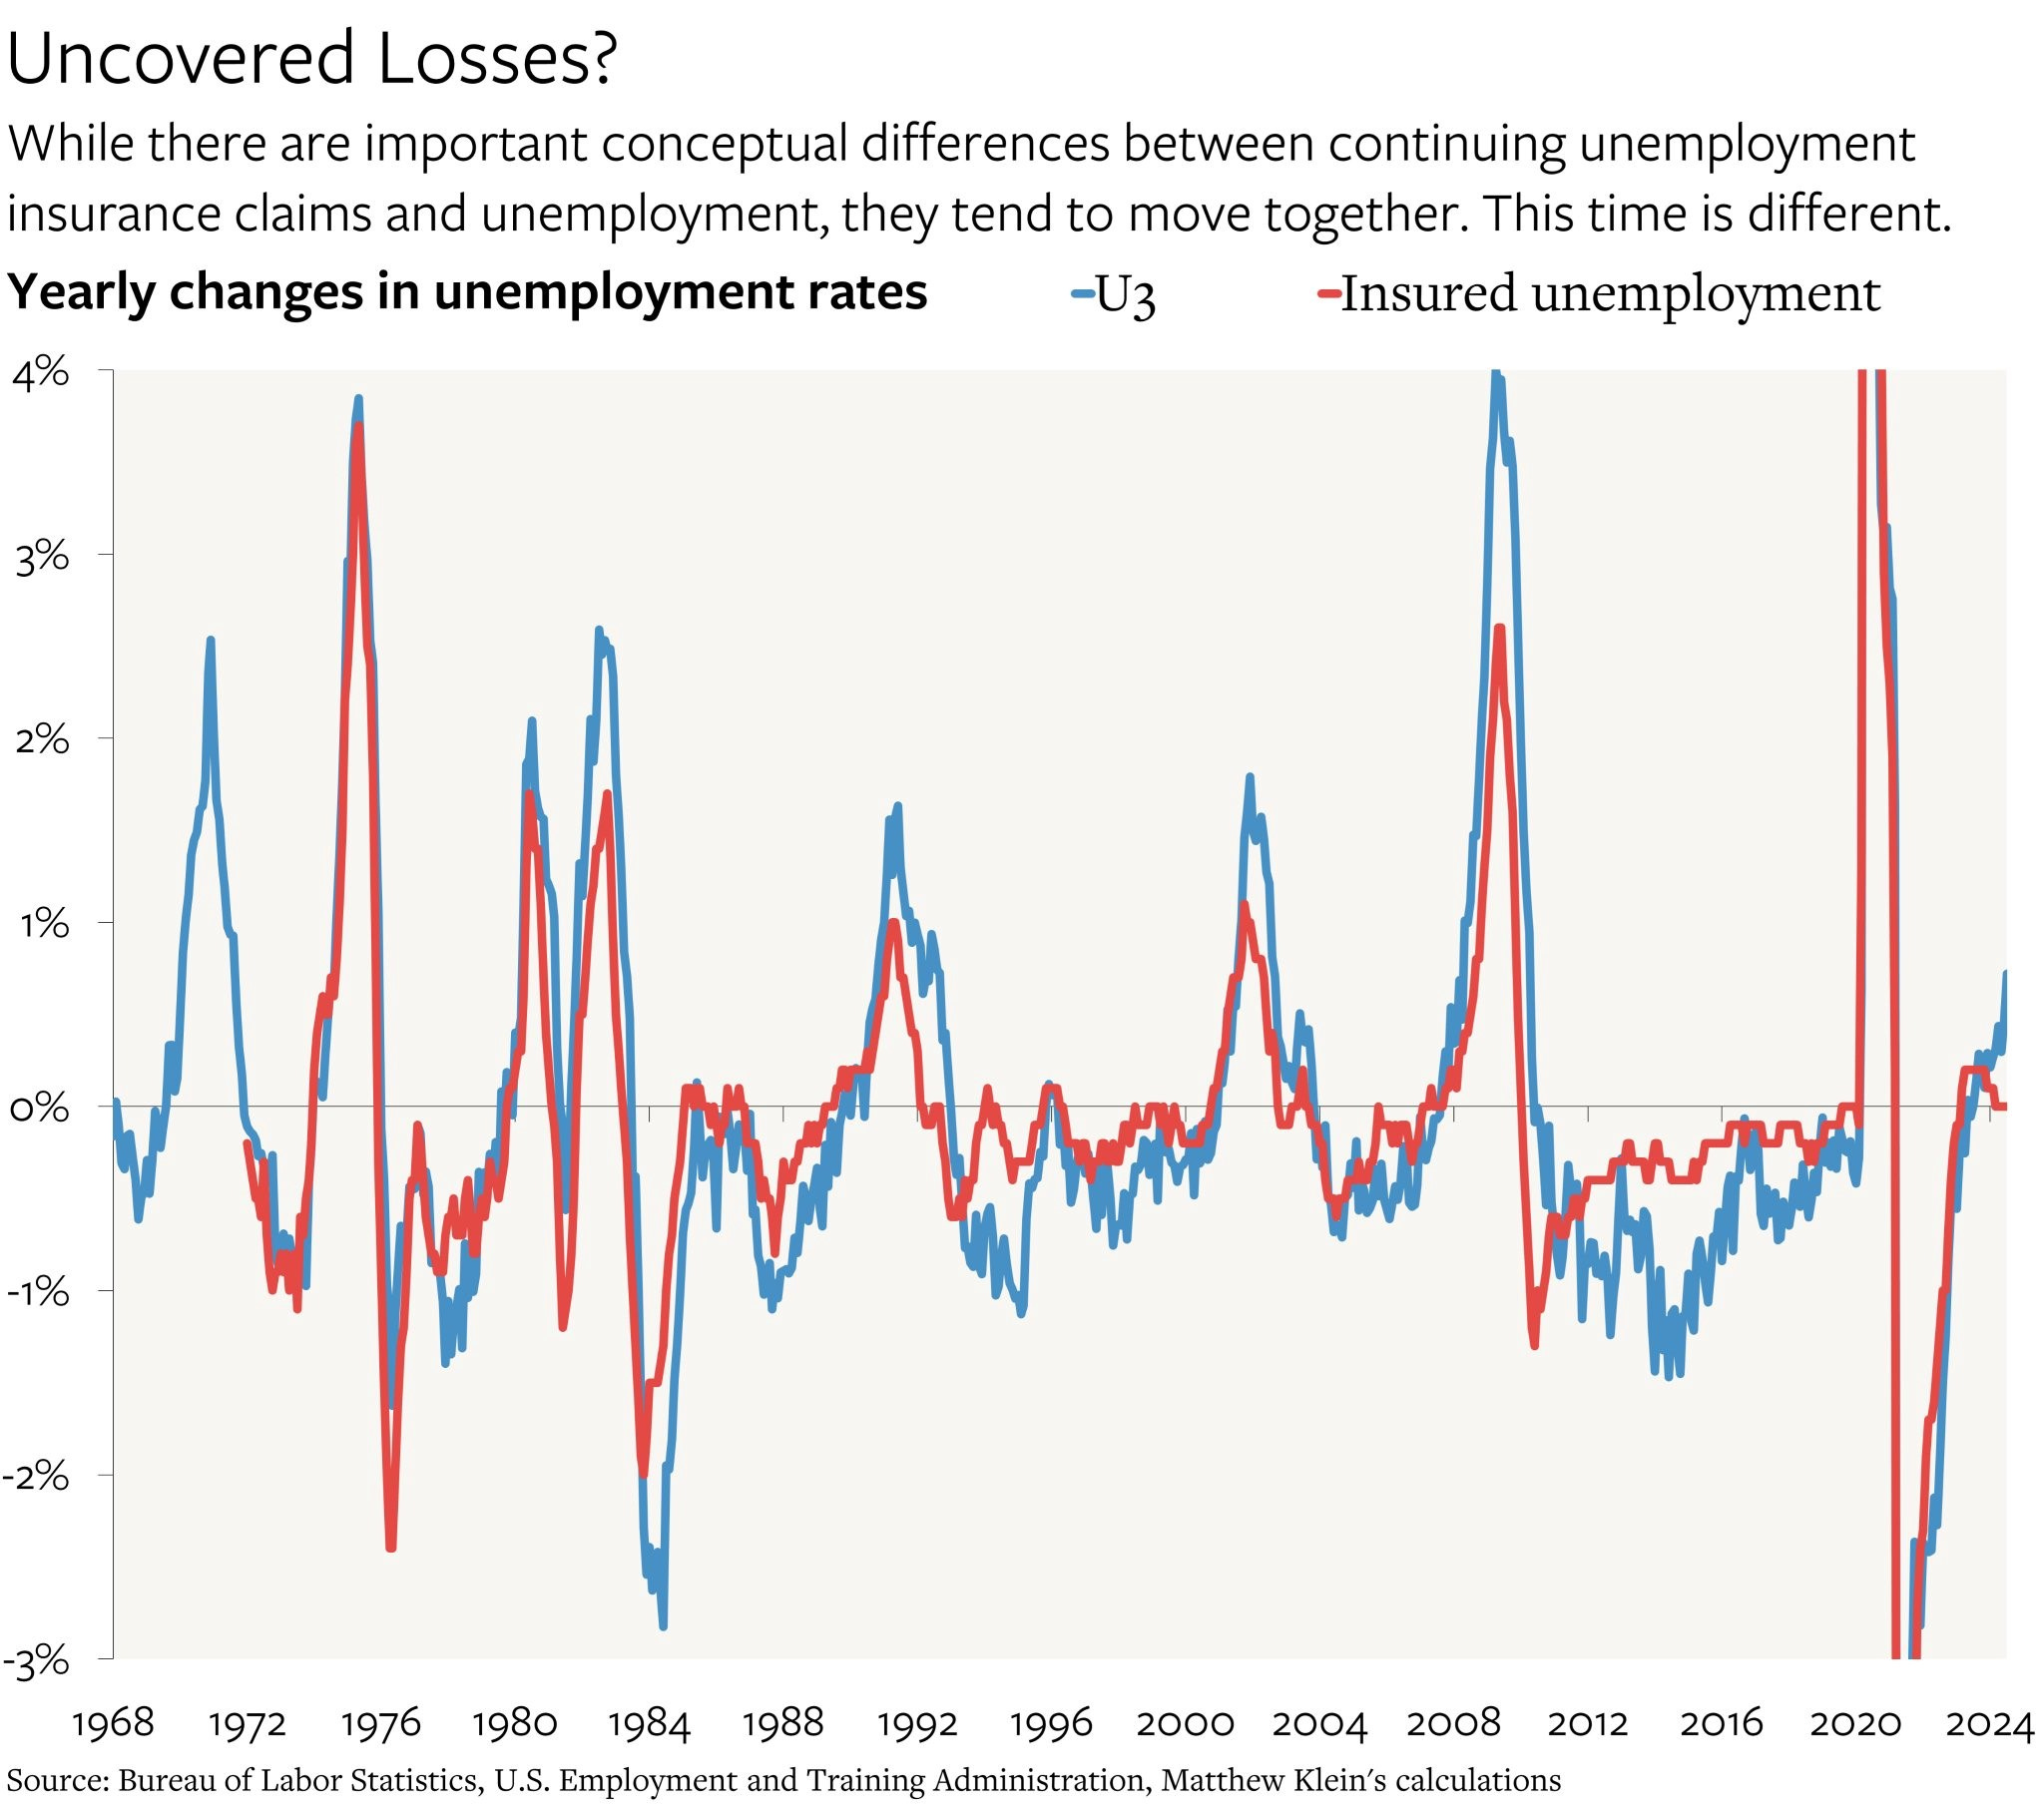
The anxiety many have expressed is that the rising unemployment rate, while still not on a net basis a result of negative monthly job growth, is on its way there and thus a spike in claims to 300k or above is coming. We have not seen that yet, but historically they are quite linked as per the below.
Thus, it’s important to break down the unemployed into categories to see if there are any insights there. What we see is that the new entrants category has been a substantial contributor to unemployment, whereas in prior cycles this has not been the case. New entrants are first time workers, so this is going to be either college students or immigrants. We also see the spike in temporary layoffs, which had a disproportionate impact on this most recent report. Permanent job losers, which is usually the category that grows the most in recessions, actually declined in recent months.
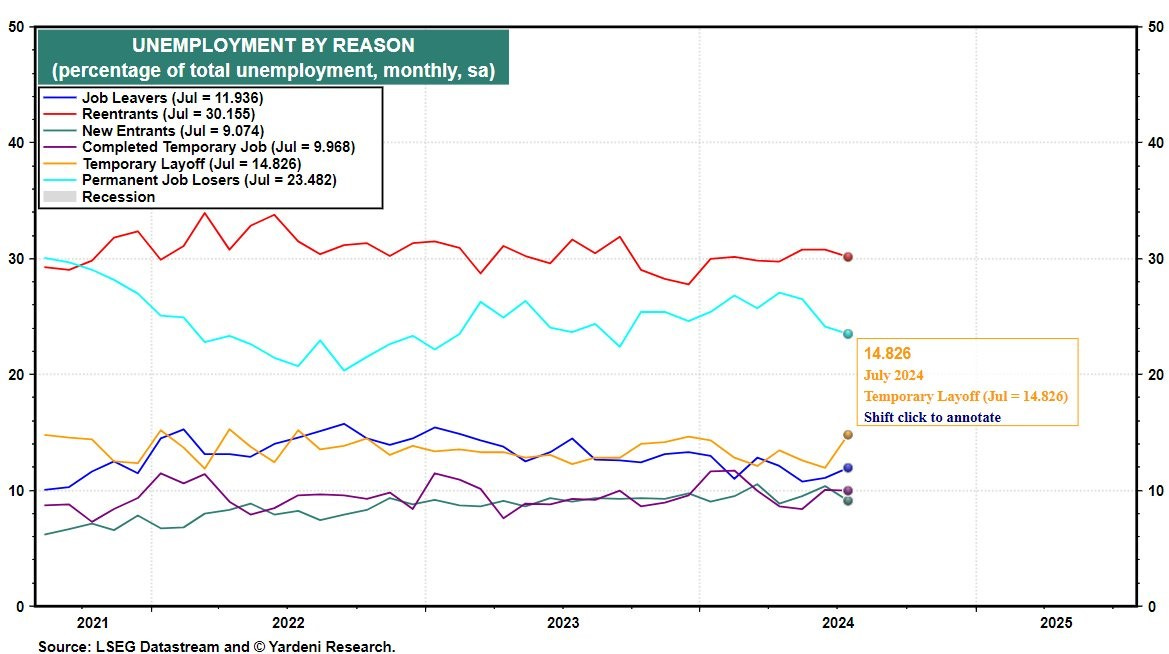
The second chart below does a nice job of breaking the categories down by month. Most recent month shows a surge in temporary layoffs that we know is hurricane related, while all of the other increase in the unemployed are new entrants. Look at the period since the fall of 2023 when the UR started rising; the share of permanent job losers has remained constant and is at the same level as October 2023, suggesting no deterioration.
The layoff rate is not only at multi-decade lows, it is actually falling even further and on par with 2021 and 2022 levels, which as we know were bonkers years of overheating.
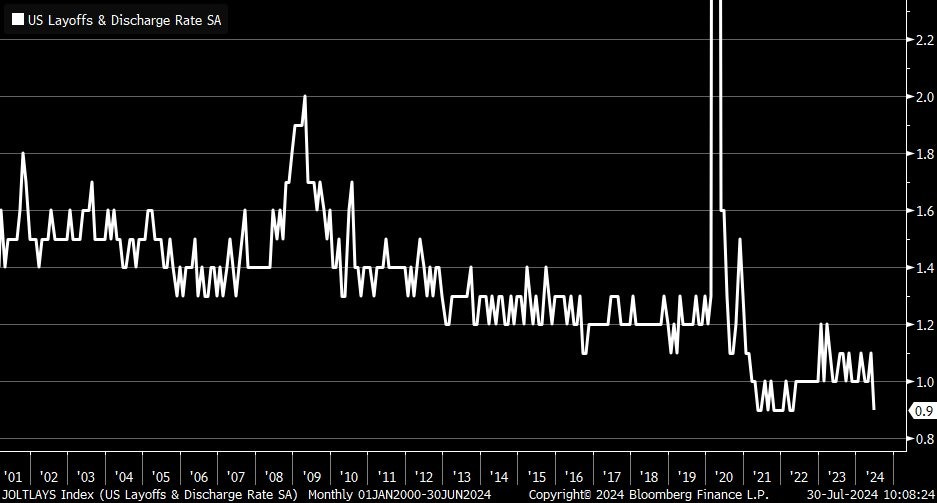
A related anecdote is that companies have mentioned job cuts at a reduced rate in recent months, thus confirming low layoffs.

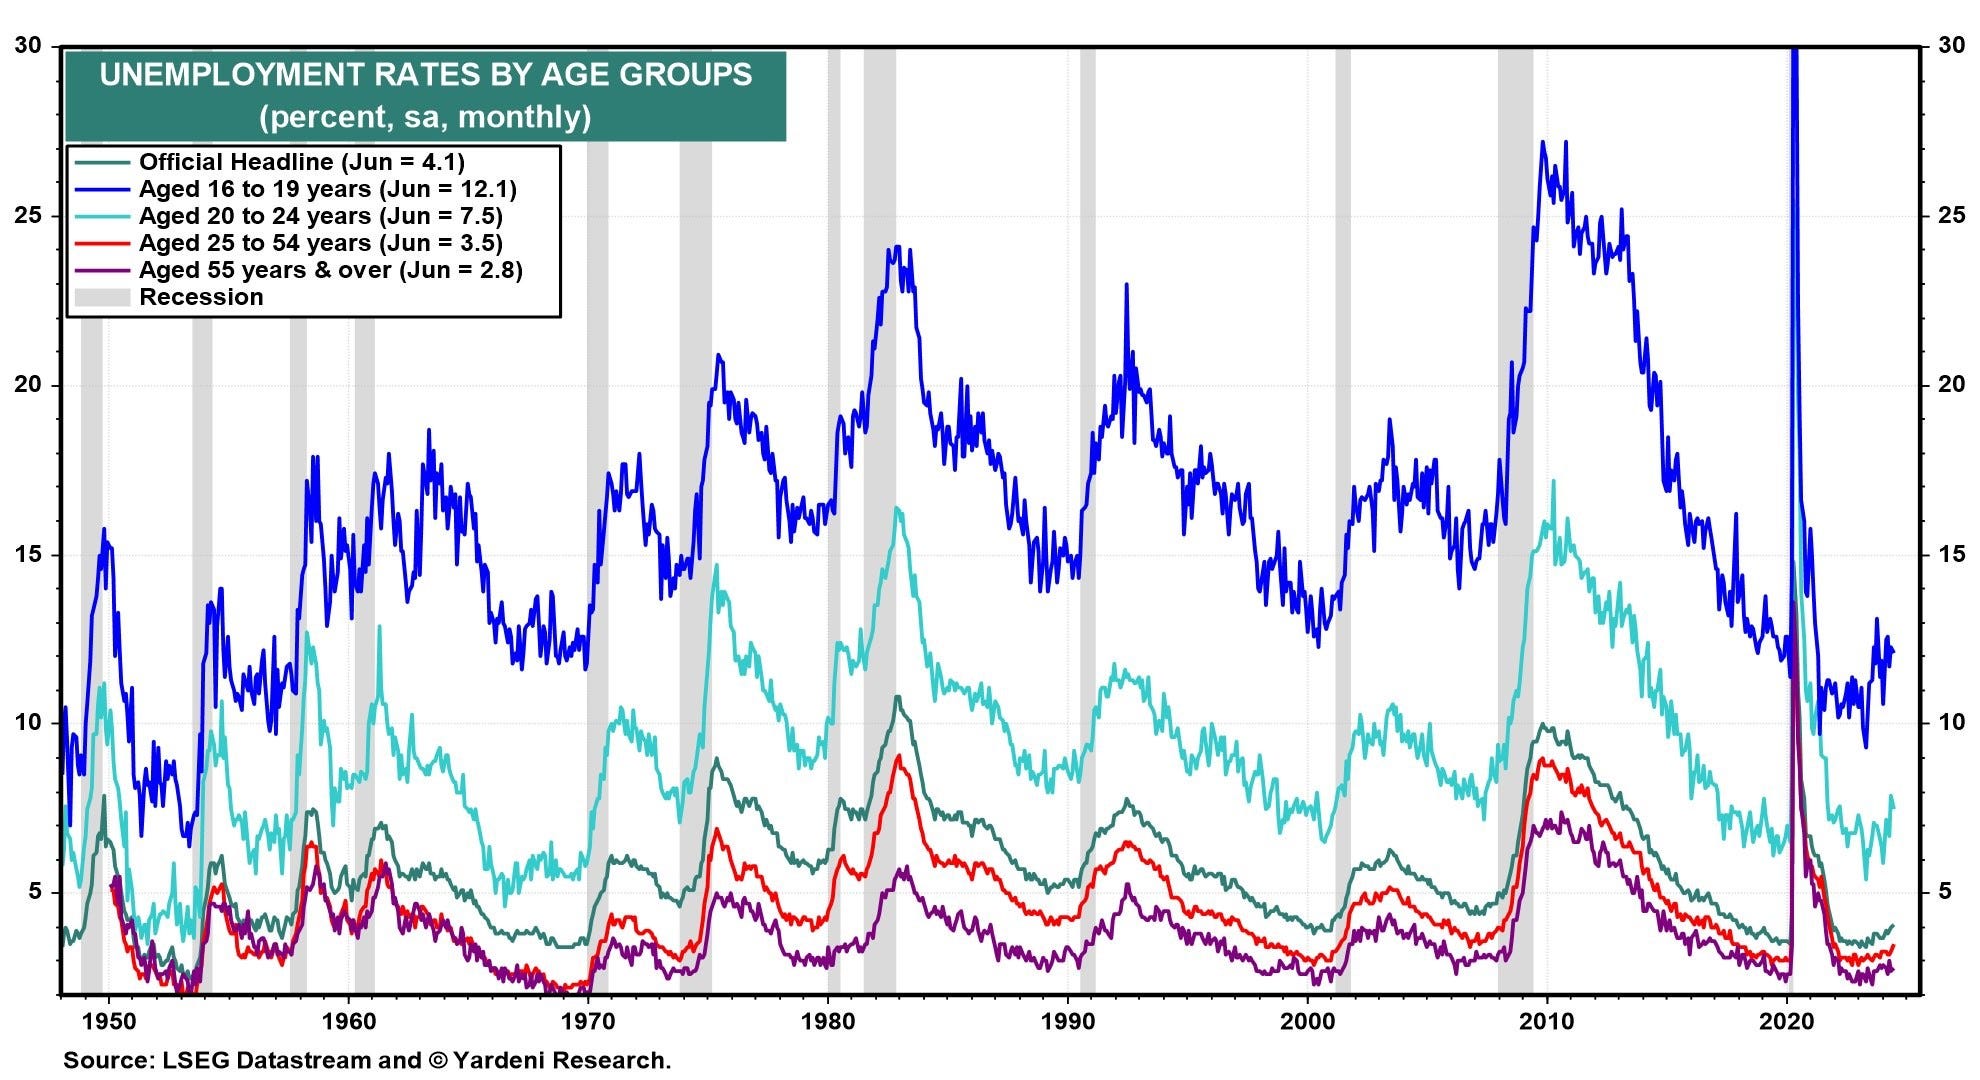
Another way to break down unemployment is to look at the various age groups. This provided really fascinating insights as the sharpest rises have been in the 16-19 (teenage) and 20-24 (college) age groups. If you look at the other age groups, they remain historically low and very tight, which lines up with the prime age employment population ratio I showed earlier. Importantly, even these weaker youth employment groups are at historically tight levels, but their inflection higher is the entire reason for the unemployment rate.
In order to understand what this implies, I had Anmol look into the youth unemployment situation. He had some really interesting insights and findings.


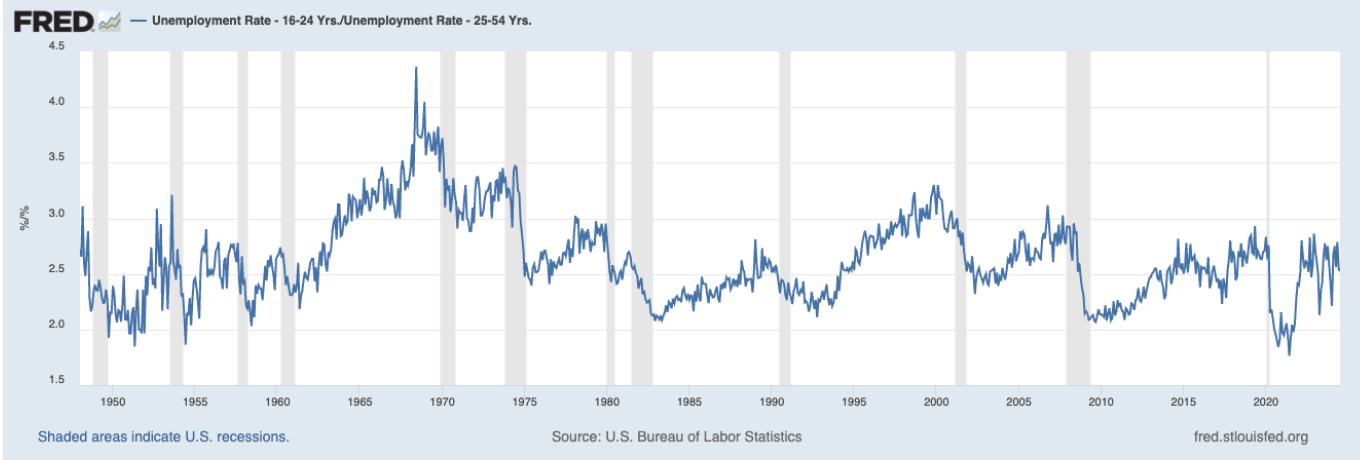
The key thing to do from here is to understand if something structural has changed in the youth labor market and if it provides insights into the broader employment situation. In fact, we do find 39.3% of youth are employed as part-time, which is increasing towards the highest levels since the pandemic.

However, a person can work part-time for economic reasons (cannot find a full-time position), or for non-economic reasons (lifestyle or to care for a family member). In fact, we find that the part-time for economic reasons for this age group is pretty much near the lowest level in history.
Thus, the majority of this is for lifestyle reasons. A University of Chicago study in 2021 (shameless plug of my alma mater) showed that the GIG economy has seen a 4x increase since 2017, and it is reasonable to conclude it is continued on this trajectory since.

We can look at this in a different way. Transportation and Delivery Platforms employment by age group shows a clear skew to the youth, so this implies Uber and Doordash and other platforms like this are employment opportunities mostly taken on by the youth and they may in fact prefer part-time work to achieve a different lifestyle than prime age workers. They might prefer the flexible hours, and might be combining multiple gig jobs that earns more than the entry level full time positions available to them.

From the same study, we can also see a gender breakdown of the influencer category of employed. In fact, we see a big increase from 2019 to 2021 for the women. This basically implies that since the pandemic, women have chosen to work as influencers at a higher rate than pre-pandemic, while men have decreased during this time period.

In fact, the share of self-employed, which includes the above categories, has surged as a share of the labor force since the pandemic to new highs. This lines up with a higher rate of business formation, and possibly the birth death model as well as the expansion of the gig economy.

There are other sociological issues affecting Youth employment. Everyone saw the enormous campus pro-Palestinian protests this school year. While some were peaceful anti-war protests, there were many that included violence, threats, verbal assaults, disruptions to classes, calls for the murder of Jews and support for terrorist organizations. They escalated throughout the year and disrupted campus life for all students, and it has resulted in arrests, Congressional investigations and civil lawsuits. A survey done by Intelligent.com had some notable findings that show employers are cautious about hiring from these college classes:

While these are difficult topics to discuss, the above is quite logical from a business perspective on top of the morality issue. Companies have to be concerned with the public relations impact to their business if an employee is out there publicly supporting terrorism and encouraging violence against a set of people of a race or religion. Additionally, it also signals difficulty with authority which is an undesirable trait for workers. Thus, this may be having a very hard to quantify impact on youth unemployment that is probably not broken down into any sort of category that we are accustomed to look out for in a report. It would also be an idiosyncratic issue that doesn’t provide evidence of an aggregate economy softening.
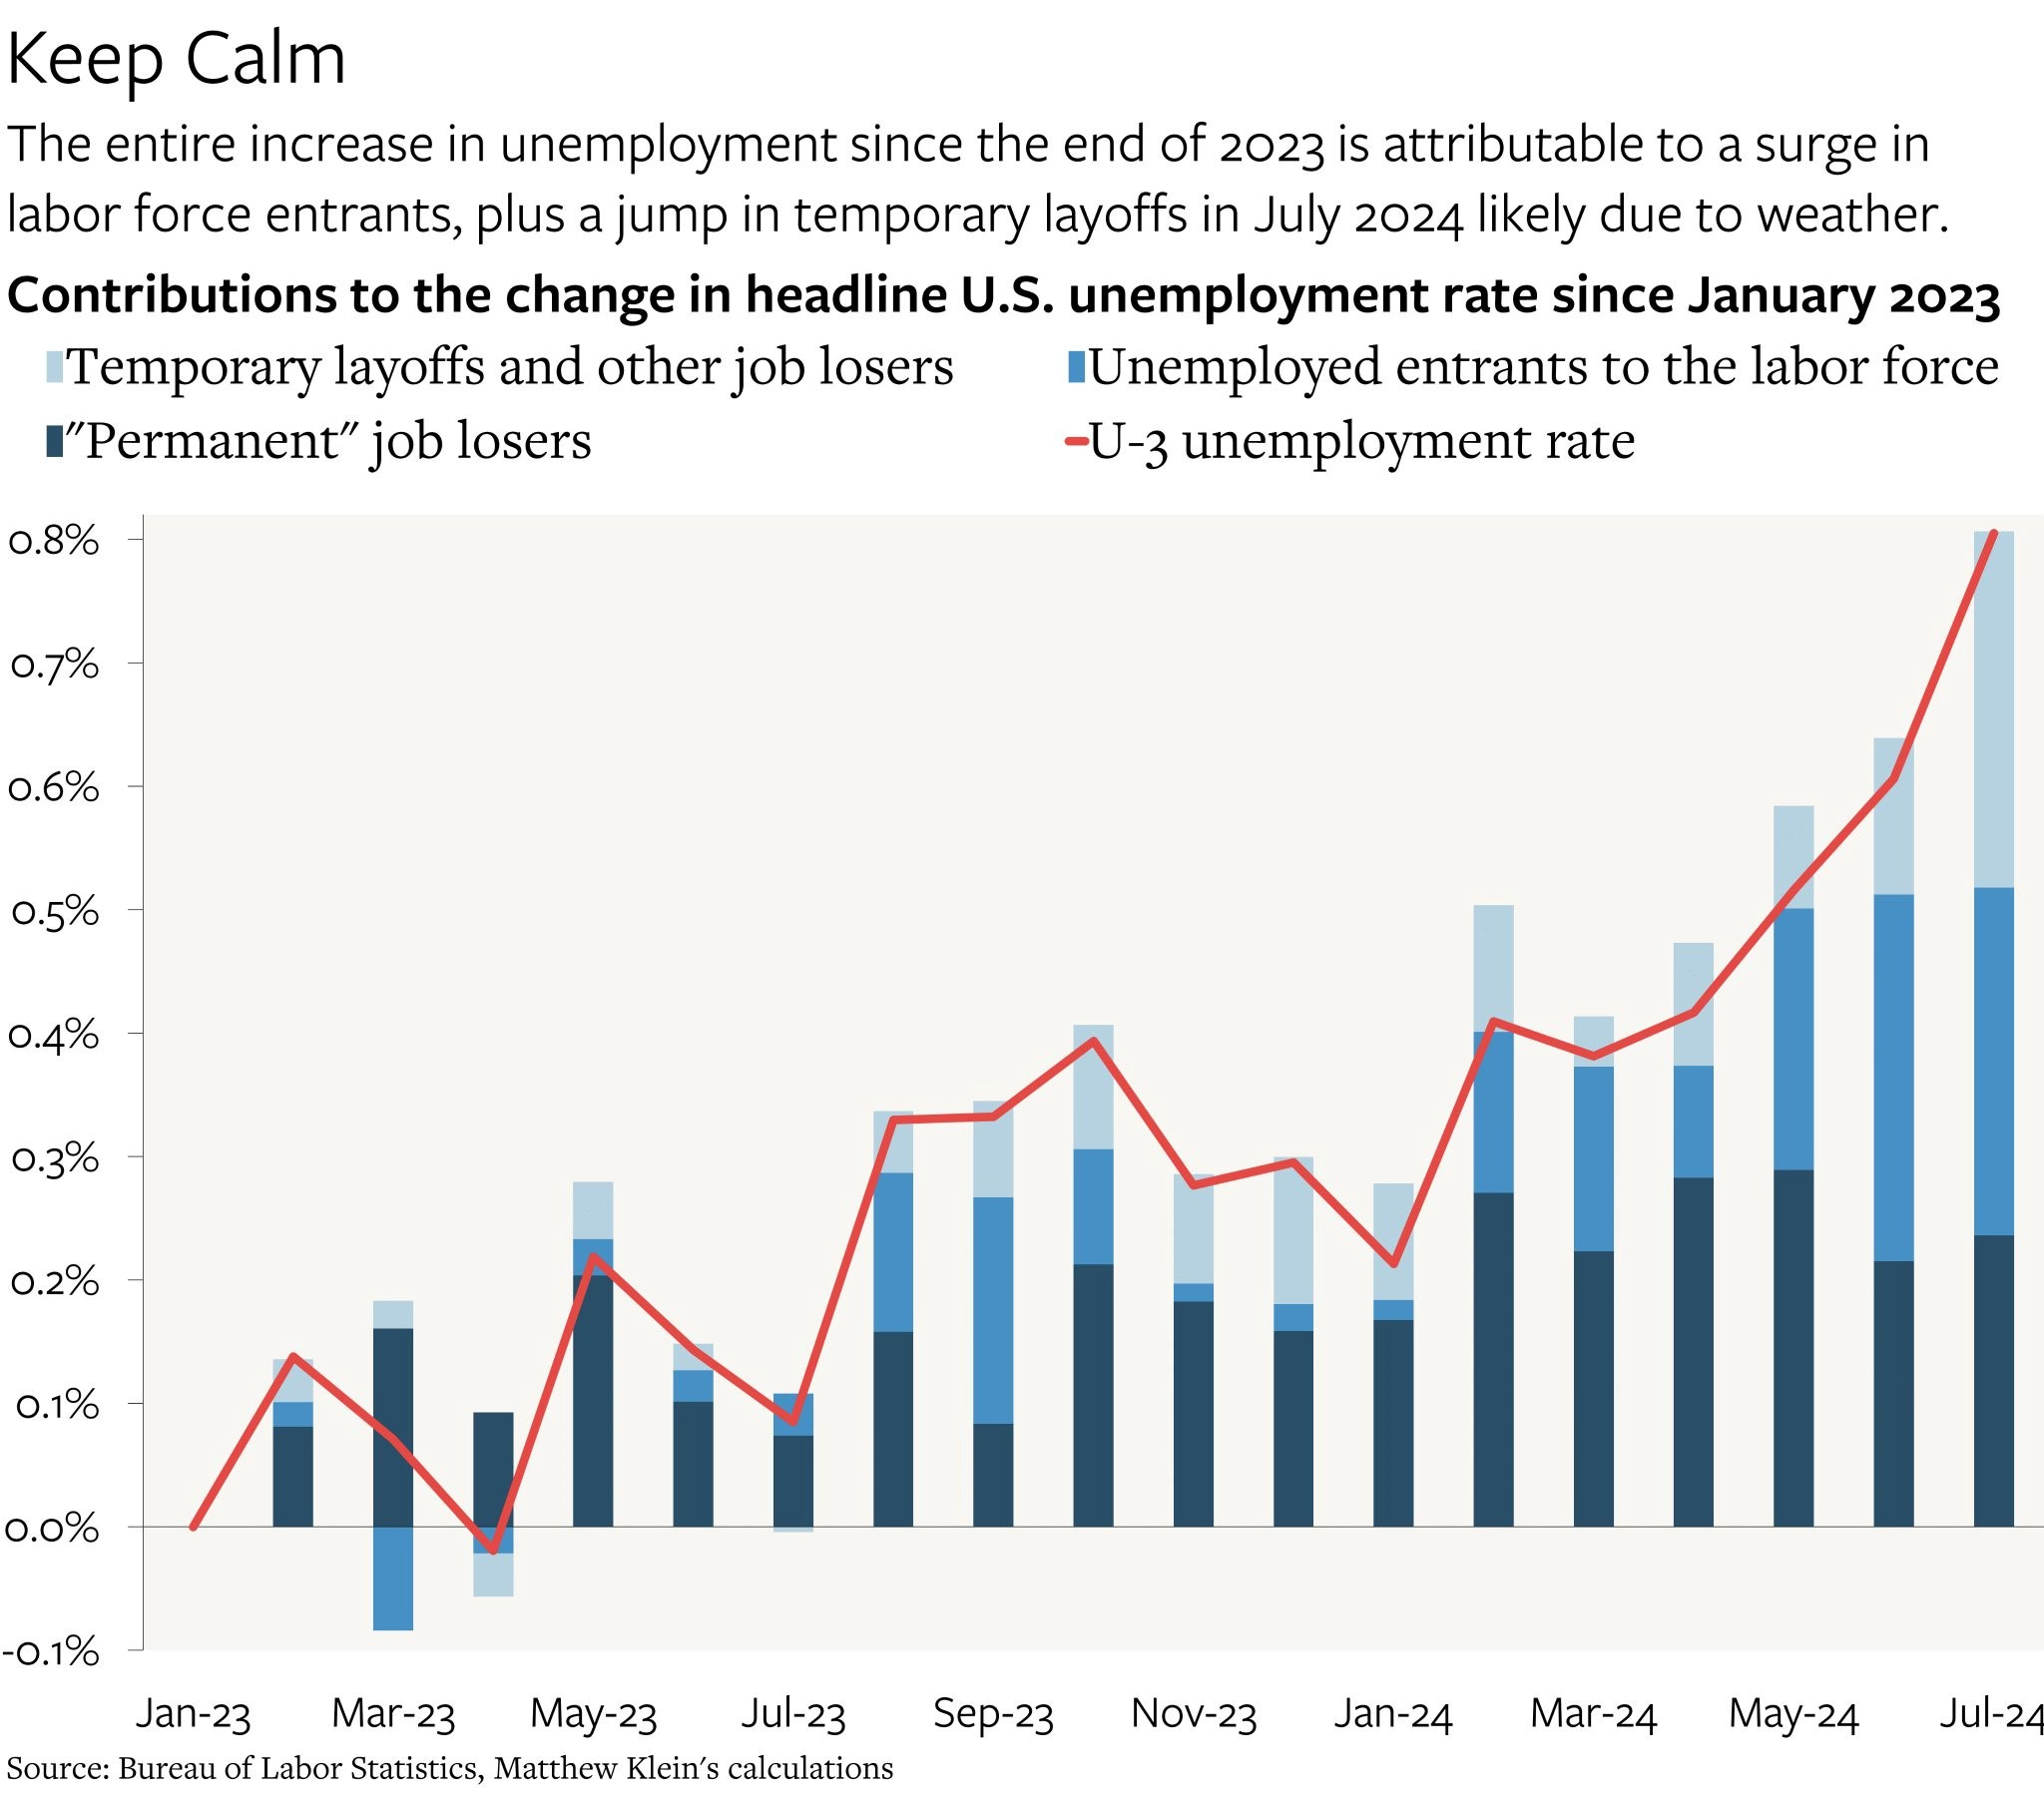
In prior cycles, we can see a clear deterioration in permanent job losers before a recession. For example, in the 2008 cycle, look at the progression of permanent job losers from the 4y prior to 1y prior periods (-0.46% or a negative contribution to 1y prior at 0.25% and finally at the peak of the recession it was 2.79%). Same with 2001. We simply do not see this deterioration at all, in fact we have a lower contribution than 2years ago in 2022 when the economy was booming!
In this cycle, we see a larger contribution from new entrants than prior cycles, and the biggest contributor is re-entrants. Note that re-entrants did not contribute in the leadup to prior recessions. Re-entrants are workers that have left their jobs to seek new employment, so this could be churn as opposed to weakness. Note the YTD level is on par with 1y ago, so no deterioration there. However, we should continue to monitor this category with an open mind given its level is higher than other cycles.

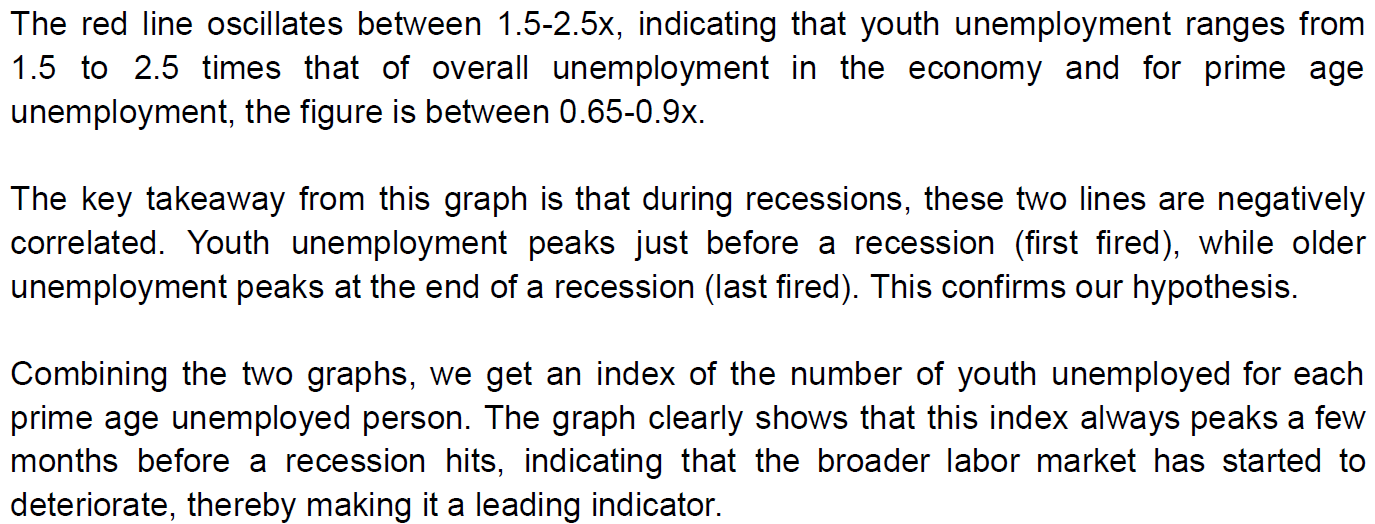
So now that we have that established, does the rise in youth unemployment signal a deterioration in the overall employment market? Not yet. Let’s look to see if it is a warning signal. The ratio of youth to prime age unemployed typically spikes in the leadup to a recession, and ultimately peaks as the recession begins. We see that it has recently peaked. Should we be concerned?

We want to study this relationship using a similar framework to the infamous Sahm “backtest”. We do the following:

We then compare the spread to a threshold that looks to signal a major deterioration.
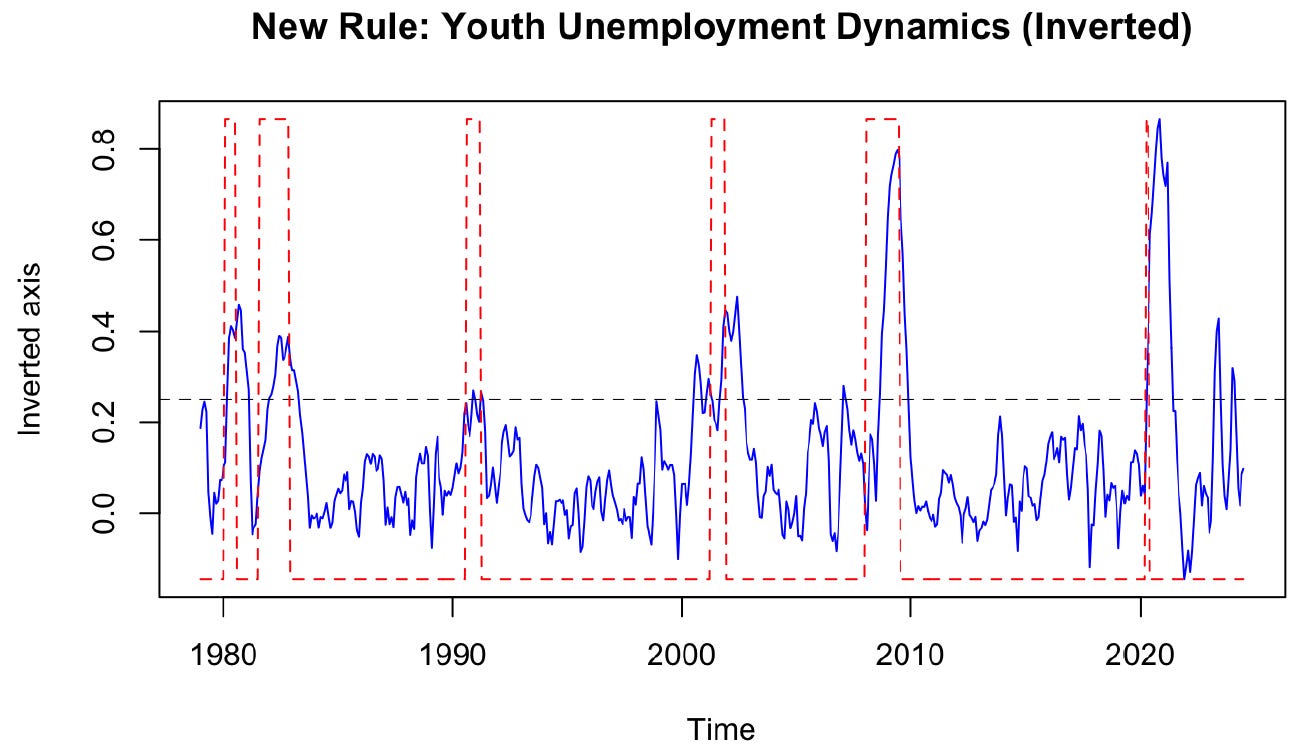
This has been a good indicator, with the threshold being surpassed 12x since 1979 and 2x since the pandemic. Prior to the pandemic, it had a 70% hit rate in calling a recession. If the Sahm backtest indicates current danger, this instead would be a leading indicator. It is moving away from the threshold as opposed to worsening. Sahm herself said her rule is overstating the weakness. This divergence between her rule and our threshold signals something is different. Caution remains but alarm bells are not singing. Additionally, we can look at the period around the Vietnam war as a comparison, when this age group protested the war, and see if it adversely impacted their job prospects and the overall economy. In fact, we do see a move up in youth unemployment relative to prime age over this period.

Our youth unemployment rule had many false positives in that period, with only 4 out of 7 trigger levels coinciding with recession. This is thus promising that perhaps the youth employment issue is more isolated than a sign of broadening weakening and we have a historical reference point to look at.

My conclusions are as follows:
The most recent NFP report contains a lot of noise due to the hurricane situation in Texas. The pop in the unemployment rate will most likely reverse next month.
The unemployment rate is likely overstating the weakness in the labor market.
The rise in the unemployment rate is mostly due to two cohorts:
Immigration. Legal immigration is what makes our society diverse and vibrant. However in this situation, we are talking about a flood of illegal immigrants. Aside from being a political issue, this seems to have been a bad deal economically for the American household sector. It has made it tougher to obtain a new job, the unemployment has risen and wages have moderated. None of those are good for workers, so it should remain a key issue for the election.
Youth employment. Rising unemployment rate is often a precursor to a broader labor slowdown, but this doesn’t seem to be the case at the moment. This age group is going through structural changes in how they seek to work, and temporary issues related to the recent campus protests. We will continue to monitor these issues going forward.
Where does that leave us in terms of policy projections and the market? My prior view was conditional; if nominal GDP stays around 6%, inflation remains sticky at 3% and financial conditions remain easy (described in the The Loop), then it would be very dangerous to cut rates and so my base case was no cuts this year with the possibility of a hawkish turn at some point due to a lack of progress. This view is currently stale, so here is how I see it now.
With job growth now slowing, in particular private sector job growth, this opens up some slack in the labor market that was not apparent to me earlier. Some slack means the Fed can manage to cut rates without a resulting move up in inflation. The simplest form of GDP= # workers x hours worked x productivity. Thus, fewer worker additions opens up the pathway for nominal GDP, which has been sticky around 6% for 5 quarters, to take a step down. Additionally, FCI has now shown two-way risk and has moved away from the irrational “bad news is good news” regime to a more normal “bad news is bad” again. Thus, with FCI tightening, this also gives the Fed the green light to cut rates to help loosen them, with no immediate concern of overheating. That being said, I do not see a meaningful amount of slack with so many aspects of the labor market incredibly tight, and nominal GDP well above potential. Thus, I think the panic type of calls for 50 bps or intermeeting cuts, are quite irrational and I do not believe recession is imminent. Nobody knows with precision how many cuts they can deliver, but I do not believe the current pricing, which is on par with deep recessions and financial crises makes any sense. H/t to
for the chart below which shows current pricing (horizontal line) with what transpired during those major recession periods. So despite calls for the Fed being late, I think they are on time. They waited for confirmation that labor is weakening, and their actions will put a floor under both employment and growth relatively quickly, in my opinion.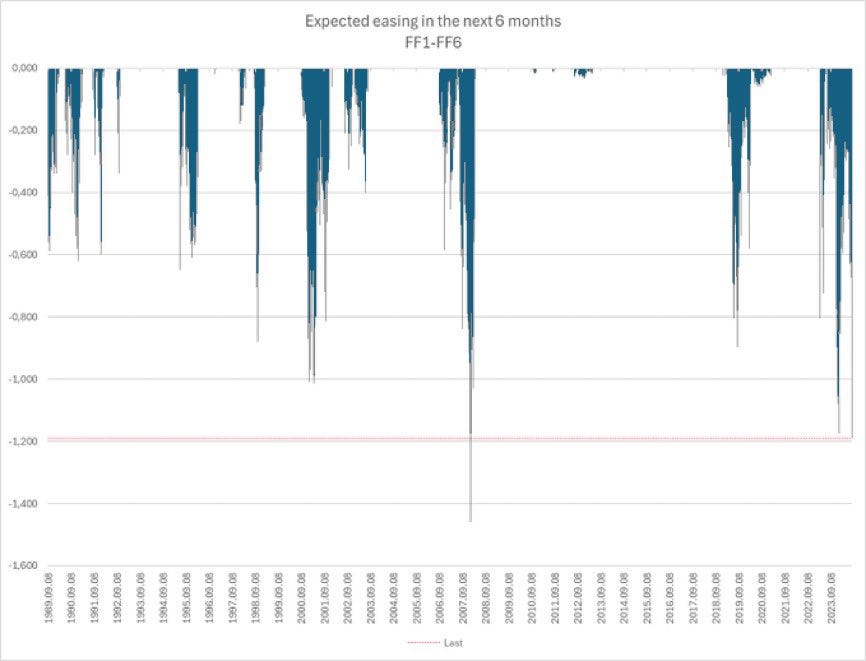
There are risks in both directions. If equities were to continue melting down in a big way, and credit spreads widen, FCI will tighten materially and lead to layoffs and a deeper cutting cycle. Alternatively, if risk assets stabilize or rebound, and the current cut pricing remains, we are likely to repeat the FCI loop again and the economy would reaccelerate once again, led by housing picking up. As I write this, the NKY has completely collapsed, as has USDJPY and S&P futures are down 3%. So the first scenario is more likely unless Central Banks stabilize the situation.
In terms of the markets, it is difficult to know when these VAR events are complete as they can often feed on themselves and systematic investors can be unpredictable in terms of when they delever and they could have more to sell this week.
Thus, I lean towards stocks being oversold, and bonds being overbought and we should retrace around 1/2 of these moves in the near future once panic subsides. Neither of these moves will be the start of a new trend, so you capture them and move on.

I don’t think chasing these moves, even if there might be more to go, makes a ton of sense. I will be patient and wait for my opportunities to go long stocks and fade rate cuts. Structural themes are not important now, it will all be about tactical trading. My RSI indicator will be great in telling me what extremes to look at. I expect the markets to trade with extreme sensitivity to growth data, while inflation data takes a back seat. Thus, if you are unsure it may also be wise to sit out the data releases.
Enjoy the rest of your Sunday.
This piece alone worth the price of annual subscription. Thank you
Could there be seasonality to the increase in youth employment? I assume new graduates just left school 1-2 months ago, and that might have led to an increase unemployment rate for those cohorts.