I write a lot about financial conditions and the FCI loop, so it’s time to do a deep dive analysis into the topic. As in the note Measuring Restrictiveness, a young and aspiring quant researcher asked to contribute to this report. I would like to thank Anmol Singh Karwal for his work in empirically testing the link from markets to economic activity. He is a graduate student of economics at Boston University, finishing his studies next month and very interested in macro research roles on either the buyside or sellside. We will get to his contribution a bit later in the note, but feel free to connect with him if you are looking for a young and aspiring macro researcher.
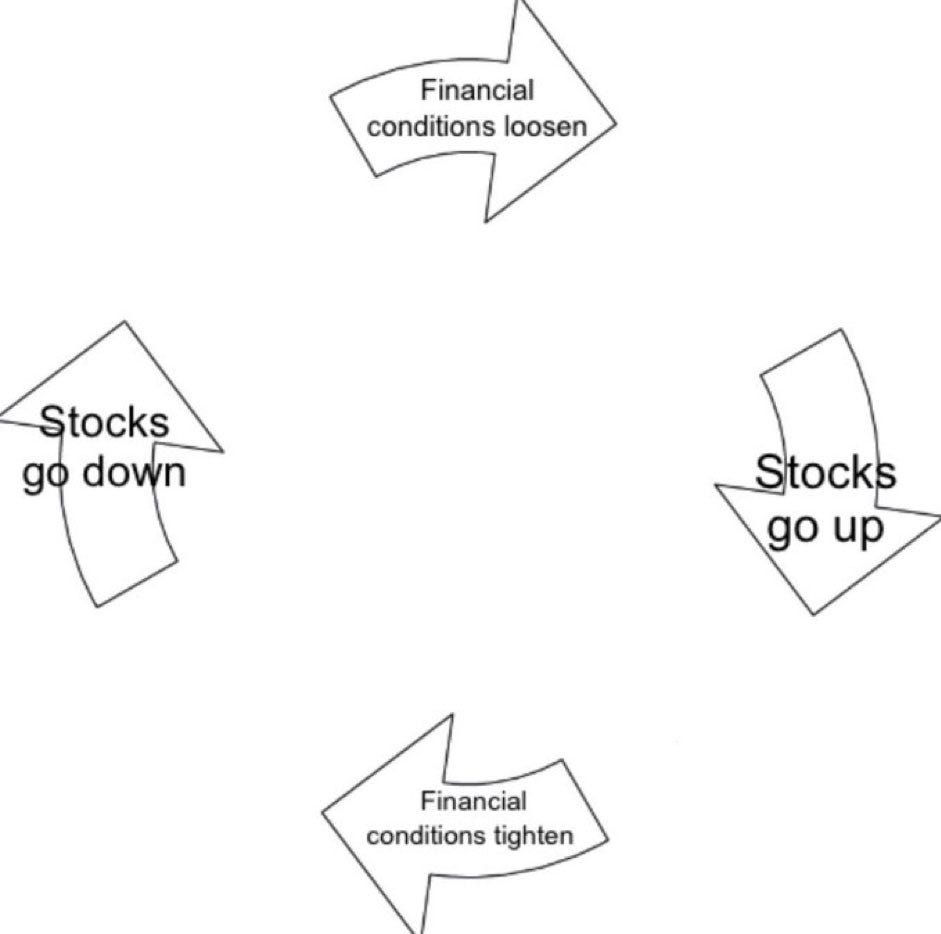
We have undoubtedly had a weaker set of consumption and inflation data of late, and the markets have responded by easing FCI further. The question is, do we have another episode of the loop like below, or is this THE slowdown everyone has been calling for?
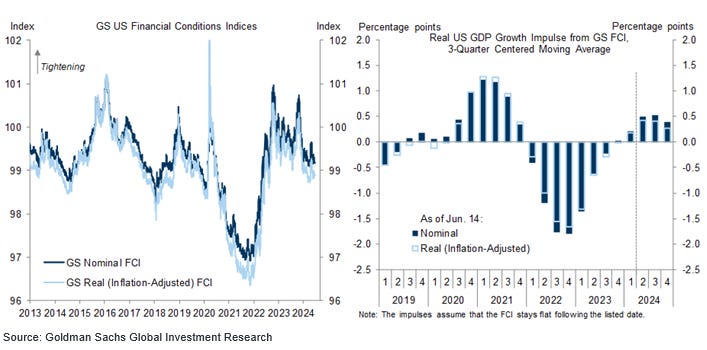
The FCI loop is a concept that large market reactions to economic developments, or Fed guidance, can counteract or even reverse the trajectory of the economy. The most famous FCI index is the Goldman Sachs index, and they also directly tie it to future economic activity as shown below. While using a simple index like the below is fine, I always prefer to hone in on the specific market movements to gauge their impacts. The FCI indices all contain the following components:
-Fed Funds
-Stocks
-Credit Spreads
-10y rate
-Trade Weighted Dollar
It is important to note that in most cases, the economy ebbs and flows and mostly chugs along. It typically takes an external shock or event to change its course. Thus, if there are structural changes to the economy, such as a large credit event or a large series of job losses, market movements alone are not going to change the trajectory of the economy. But if we are in a status quo situation, where nothing has materially changed from a month ago to today, and we have large market reactions, they can drive incremental changes to the economy on the margin. When we are at a policy stance where the Fed is trying to slowly (not abruptly) restrain economic activity to rid the economy of excess demand to get inflation down to target, large FCI movements can either enforce their policy stance or undermine it. Unfortunately, it has undermined it more than supported it throughout this cycle. Let’s look at a few case studies, where large FCI easing has caused economic activity to reset higher and prolong the inflationary episode.
Episode 1: November 2022. The Fed had just slammed the economy with 4 straight 75 bps hikes. Given that they were now at a 3.8% policy rate, they decided to indicate that they would downshift to 50 bps hikes at the next meeting. It should be noted that 50 bps hikes are still quite large and that this is still material tightening, but the markets took this as a sign that they are close to the end of tightening and got excited. As such, we saw the following market reactions:
-10y rate declined from 4.2% to 3.33%
-SPX rallied by 12.5%
-Dollar sold off by a very large 12%
Keep in mind, the Fed was still tightening policy aggressively in this period, so economic activity should have been continuing to moderate according to traditional economic theory. However, within a few short weeks, we started to see the early signs of the economic impact from the very large loosening in FCI.
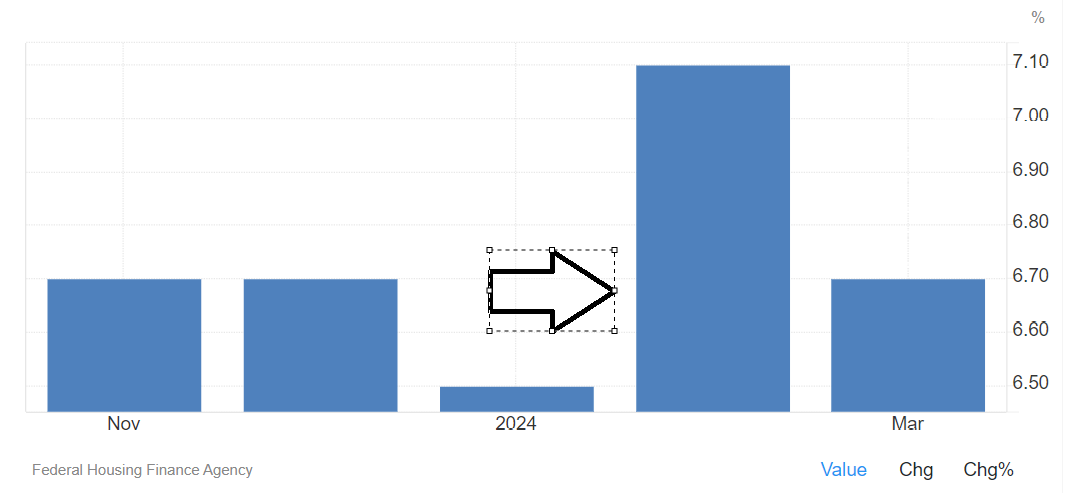
-Mortgage applications surged by 34% within a few weeks.
-With a short lag, we see job gains materially higher from a 136k pace to 482 & 287k prints.
-Within 2-3 months, we see a material step up in new home sales.
-With a slightly longer lag, we start to see housing prices step up.
-We get a similar pop in monthly retail sales.
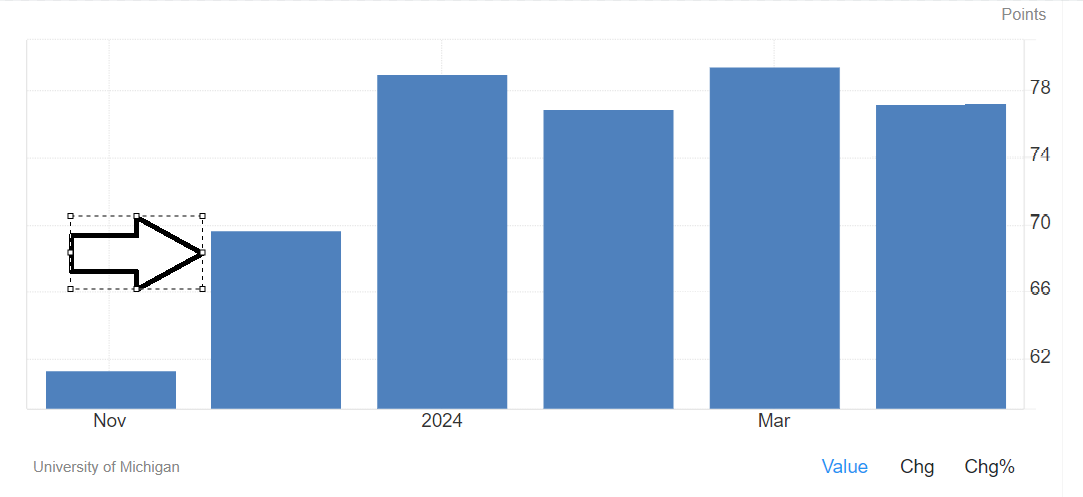
-Which is directly tied to consumer confidence improving.
-Thus, it is not a coincidence that monthly core inflation prints also start to move higher.
This loosening episode had the potential to see the economy overheat again, which is why the Fed, after having downshifted from 75 bps to 50 bps and then 25 bps hikes, was actively discussing moving back to 50 bps increments. However, SVB happened in early March which caused abrupt tightening and prevented this from occurring.
Episode 2: Post SVB, May 2023. Once the Fed turned a potential banking liquidity crisis into a slow moving solvency affair limited to a few weak regional banks, the worst of the economic impacts were avoided. However, during this period, financial markets had reacted in a big way and sustained that easing.
-From March until mid May, the 10y had declined from 4.1% to 3.33%. More importantly, we had priced in 150 bps of rate cuts for the second half of that year that the economy did not need.
-SPX rallied by 9%
-Dollar was 5.4% weaker.
We started to see similar behavior as in the last FCI episode.
-MBS apps bounce by 10% within a few weeks.
-A notable improvement in job gains from a 184k pace to 246k.
-Within 2-3 months, we get a 4.5% pop in new home sales.
-Which comes with a near doubling in housing prices growth from a 3% pace to a 6% pace.
-Consumer confidence has a notable and sustained move higher.
-Which naturally leads to an improvement in monthly retail sales.
-Which leads to core MoM inflation progress first stalling, then shifting higher.
Of course, markets reacted to this, with the 10y rising from 3.45% in May to 5% by end of October in what I have called the “Term Premium Tantrum”. SPX declined by 10%, and the Dollar strengthened by 7%. Naturally, these moves had the opposite effect and started to moderate growth. October data was materially weaker in all respects, with growth and inflation stepping down.
Episode 3: Dual Pivots. In response to the term premium tantrum, the Treasury reduced their coupon issuance and tilted heavily towards bills. The Fed started talking dovishly, discussing rate cuts much more openly and even adding potential timelines for them. This all coincided with the December FOMC meeting where this was discussed more directly as the next course for policy. Over the November and December periods, we saw the following market reactions in response to the pivots.
-10y declined from 5% to 3.8%
-SPX rallied 17% in 2 months. It has never stopped since, rallying another 15% YTD.
-Dollar weakened by 4.7%.
The reactions in the economy were predictable for me after seeing the prior episodes.
-Within a few short weeks, we get a material move up in MBS apps by 24%.
-Job growth once again stepped up its pace.
-With the standard lag, we see new home sales pop by 9% by March.
-Which coincides with housing prices accelerating slightly. Notice we never returned to the prior 3% pace, moreso maintained the 6%+ pace and moved above 7% for a month.
-Consumer sentiment reacted quickly.
-Retail spending naturally improved for the next 2 months.
-Naturally this led to a move higher in monthly core inflation.
We also started to see some other interesting dynamics. Namely, the corporate sector decided to issue large amounts of debt and deal with the corp maturity wall. The increase in financing as a result of the Fed pivot is quite clear to see.
It wasn’t just investment grade; we saw a big move up in LBOs as well as High Yield.
Of course, by end of April, the 10y had moved to 4.7%, which was a full 100 bps higher than beginning of year levels. This naturally imposes some restraint on some of the more interest rate sensitive components, and potentially leading to the softer data we have seen in April/May economic data releases.
Now that we have looked at the way FCI moves have resulted in economic movements, let’s try to understand why they are so impactful.
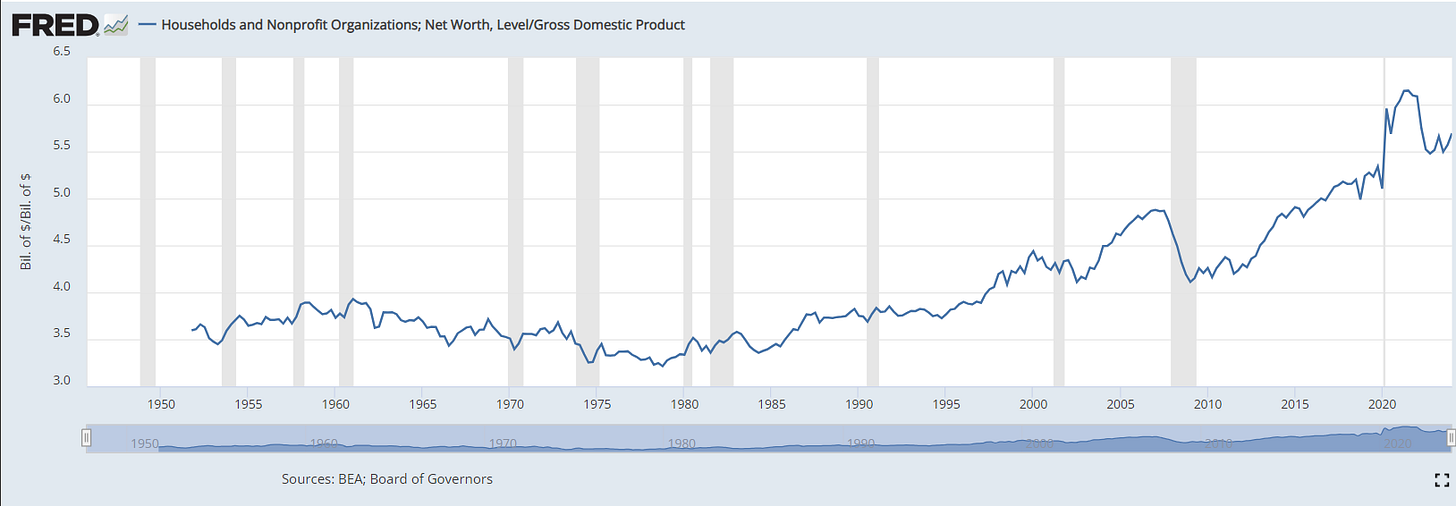
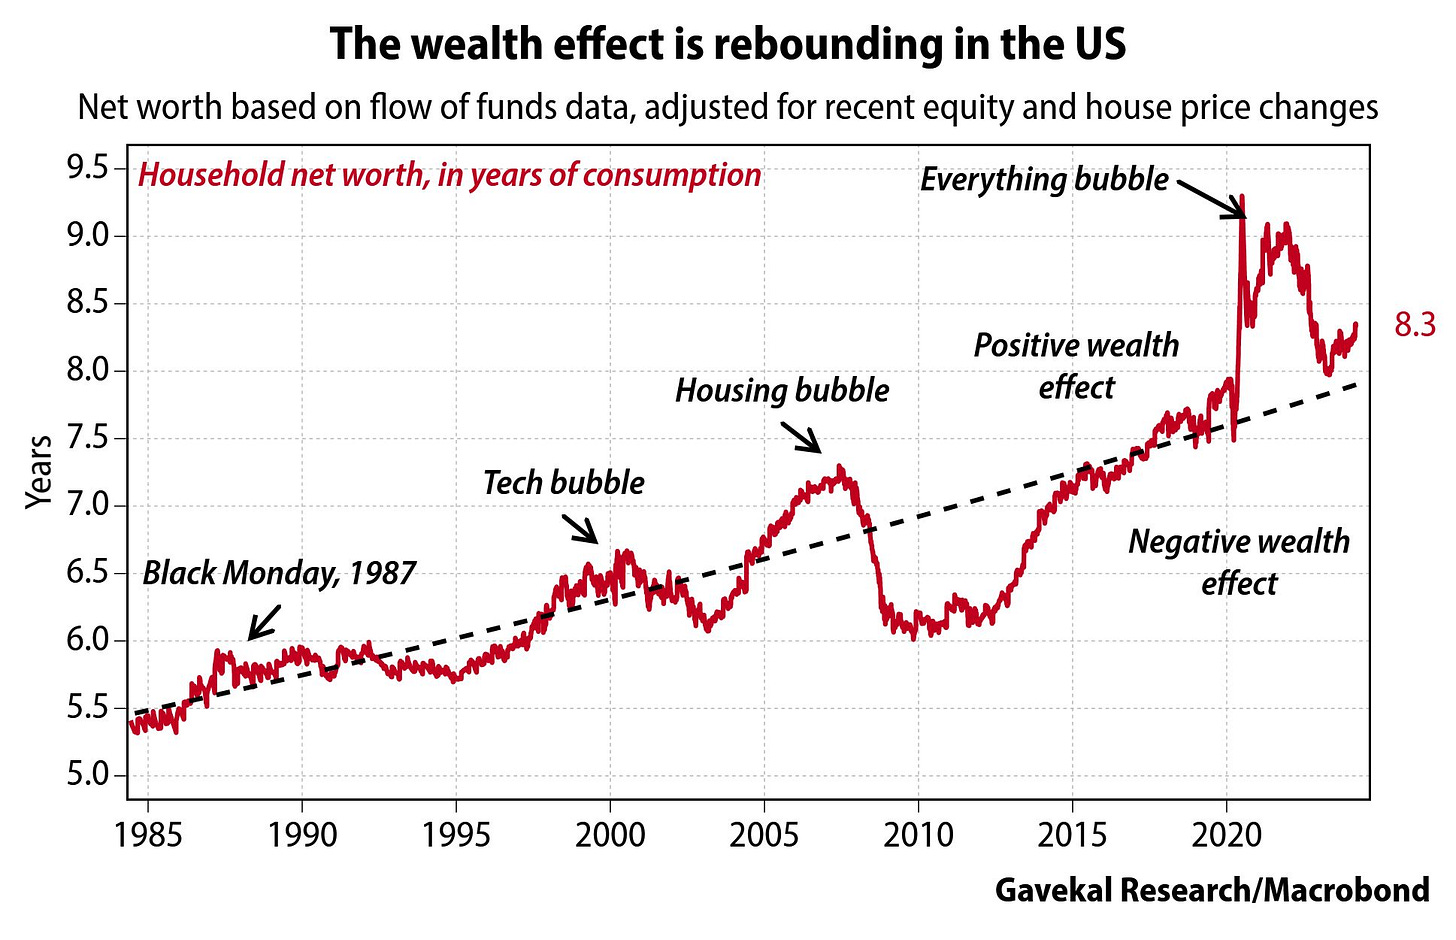
The first thing to note is how financialized the economy has become. Household wealth to GDP was roughly 300% in the 1970s, and we notice a huge surge starting in 2010. This is not a coincidence, as the QE policies were directly targeting the wealth effect as a way to stimulate the economy post GFC at a time when major deleveraging was occurring in the economy and demographics were deflationary. It was the only channel the Fed had. However, we now have household wealth approaching 6x the economy. As such, moves in asset markets can have a much larger impact on the economy than they used to. Wealth is orders of magnitude higher than the trend experienced over the last 40 years.
Additionally, wealth gains this cycle are well over 55TRN in just 4 years, which is nearly 2x the economy’s size. Since the winter pivot alone, we are talking about over 13 TRN in wealth gains (the chart below is as of 2 months ago, so it is higher now). Keep in mind that total consumption by households last year was $19TRN. We have nearly generated an entire year’s worth of consumption in wealth in just over 6 months.
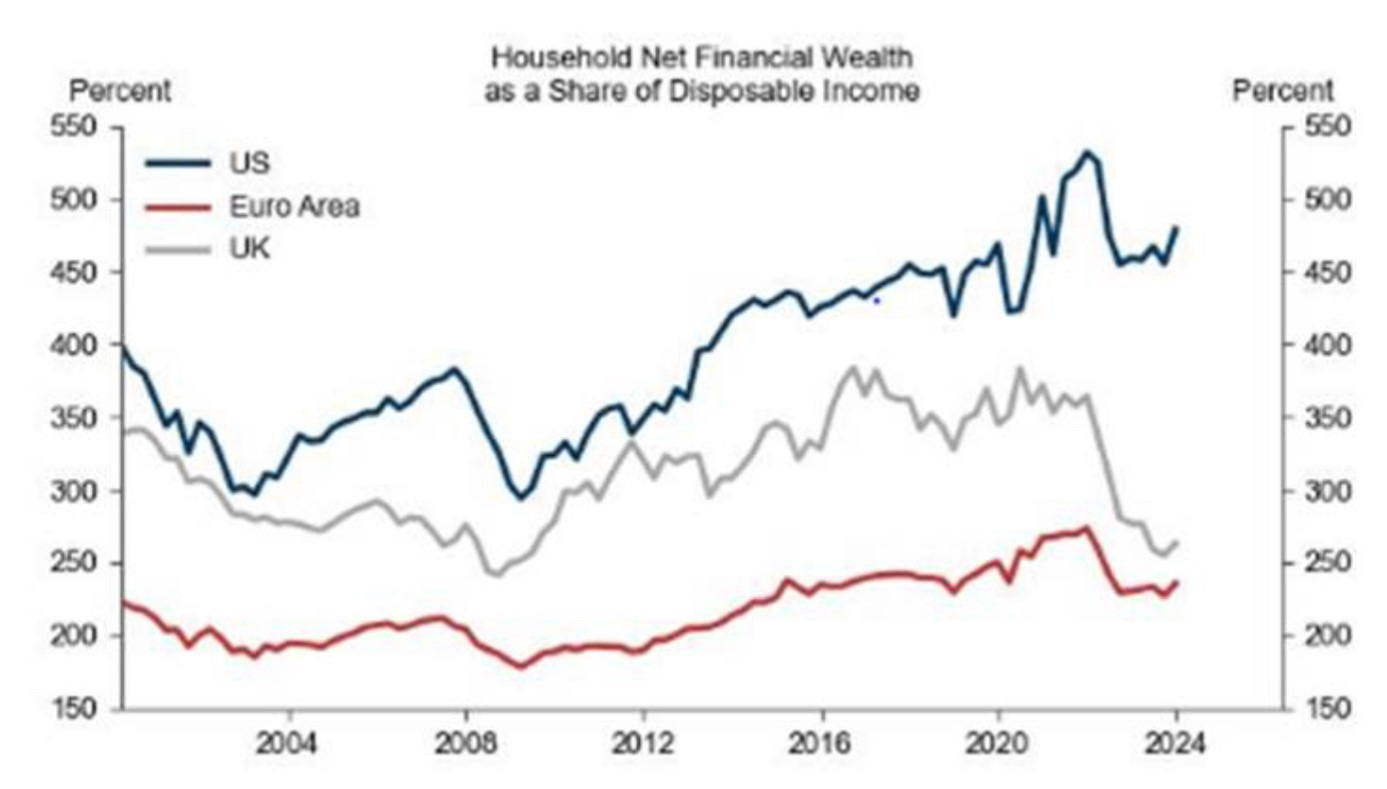
Wealth gains are also substantially larger for US households than other countries, contributing to the exceptionalism situation.
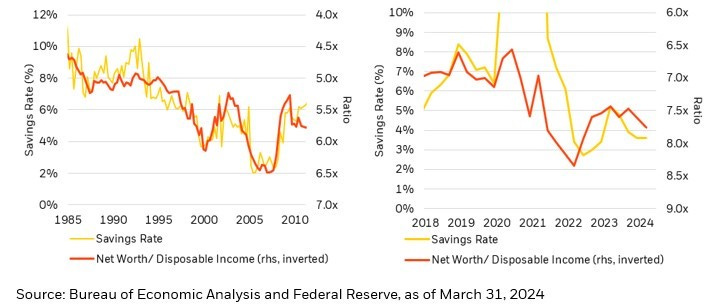
Wealth gains are seen as directly tied to the household savings rate. The savings rate is historically low, partly due to demographic changes but also due to wealth increasing much faster than incomes as shown below. An increase in the savings rate would indicate that consumers view the economy as risky, and want to take chips off the table. When savings are a substitute for consumption, and/or equity or housing investments, the economy will sustainably slow.
We can see that FCI is directly related to global liquidity conditions. Thus, the BTFP facility which increased reserves, and the tapering of QT, have been contributing to looser FCI.
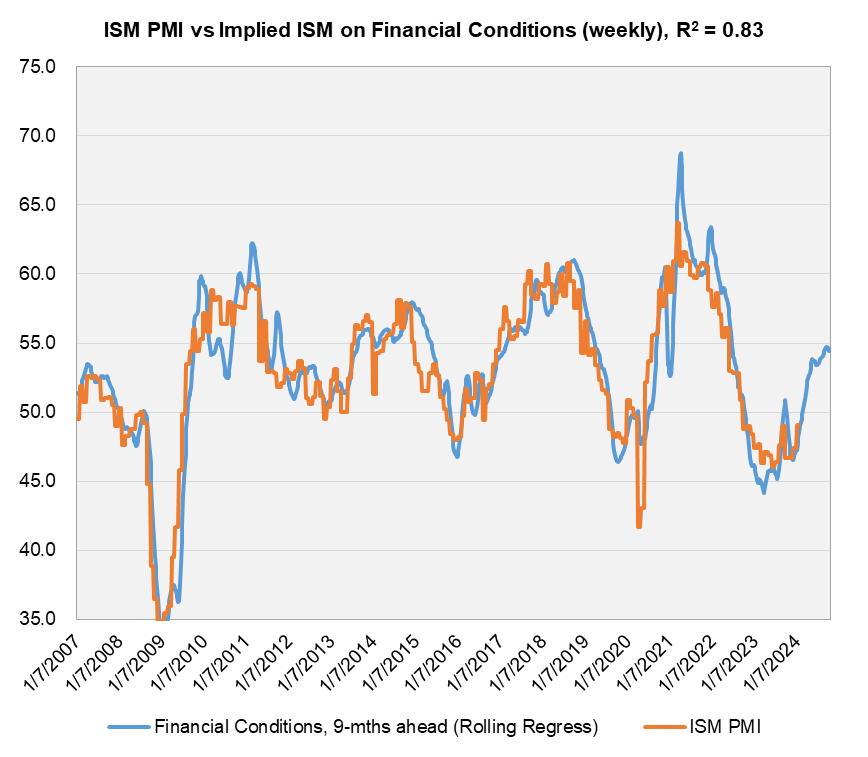
FCI leads to improved cyclical activity, manufacturing, with a lag. We are right at the period where that lag should hit according to the below. I think manufacturing and the goods sector improving is the next growth engine for the economy.
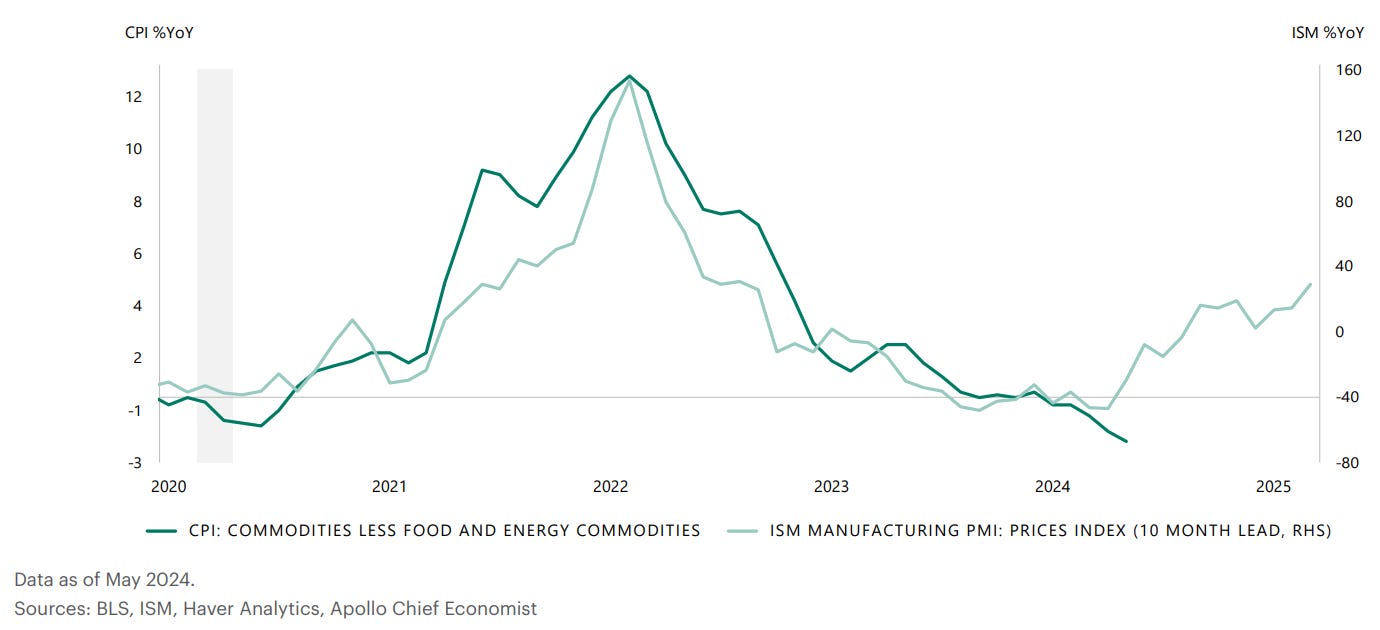
If manufacturing improves, goods inflation will too.
Putting it together, it paints a picture of upside for growth while everyone is focused on downside.
Ultimately, the easy financial conditions leads to inflation increasing as well.
All of the above is nice, but I am sure economists that read this are fuming because none of the above is supposed to happen when the Fed tightens! My argument is that this only occurs if policy is not sufficiently restrictive. “Sufficiently” is the key word.
If policy were sufficiently restrictive, we would see:
-Consistent deterioration in sentiment and spending.
-Consistent decline in housing prices and activity.
-Declining nominal GDP.
-Corporate profits weakening.
-Increased savings (especially at these levels of rates) at the expense of investments and spending.
We do see some of these, so do not take my comments about being insufficiently restrictive to mean that monetary policy is loose or impotent. It is simply not tight enough if we get the ebbs and flows we have seen, or periodic reaccelerations. For context, we have not seen those in other economies that have been more successful with their inflation battles.
Canada is a great case to look at because of its tight linkages to the US economy, its status as a large oil producers, flexible labor markets, similar transfer payments during the pandemic and a big surge in immigration this cycle. The most notable difference is the household debt situation, with Canada far more vulnerable due to weaker household balance sheets and a mortgage market that resets effective rates every 5 years (vs. 30yr fixed in the U.S.).
Given that they both hiked at the same pace and landed at almost the exact same terminal level of policy rates, is it thus surprising that Canada has had a more effective economic response and inflation outcomes? Why would we expect the same results given the situation above? The chart of housing price changes comes courtesy of Deer Point Macro, whose work focuses heavily on the Canadian economy and the data comes from the Dallas Fed.
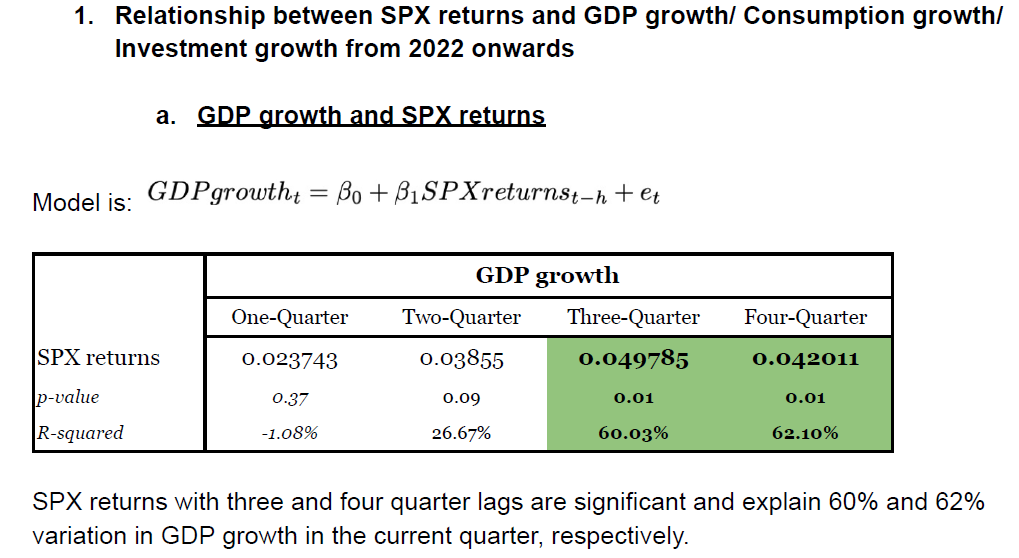
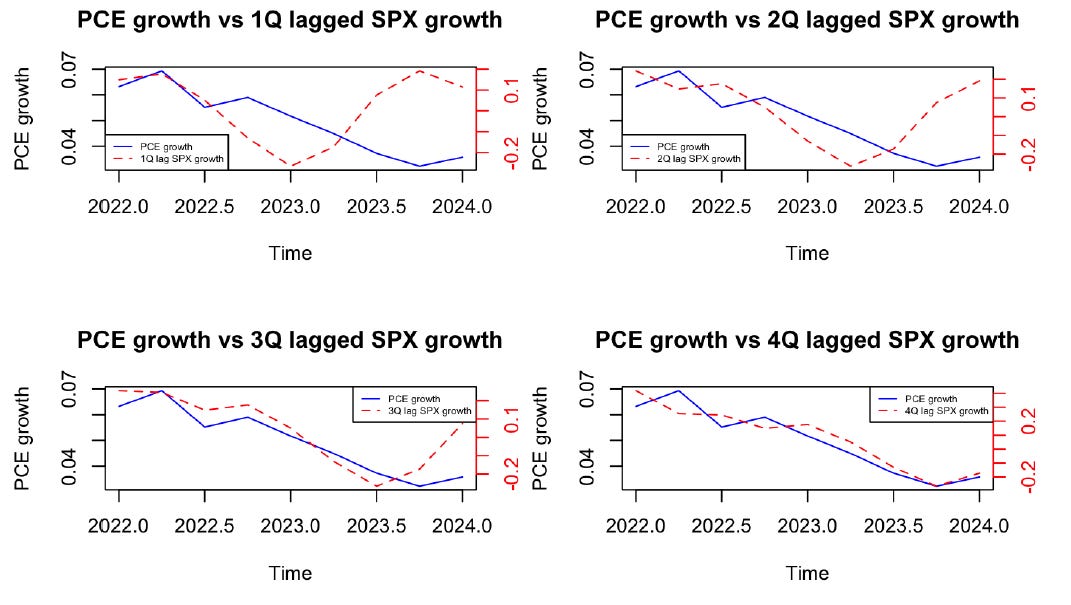
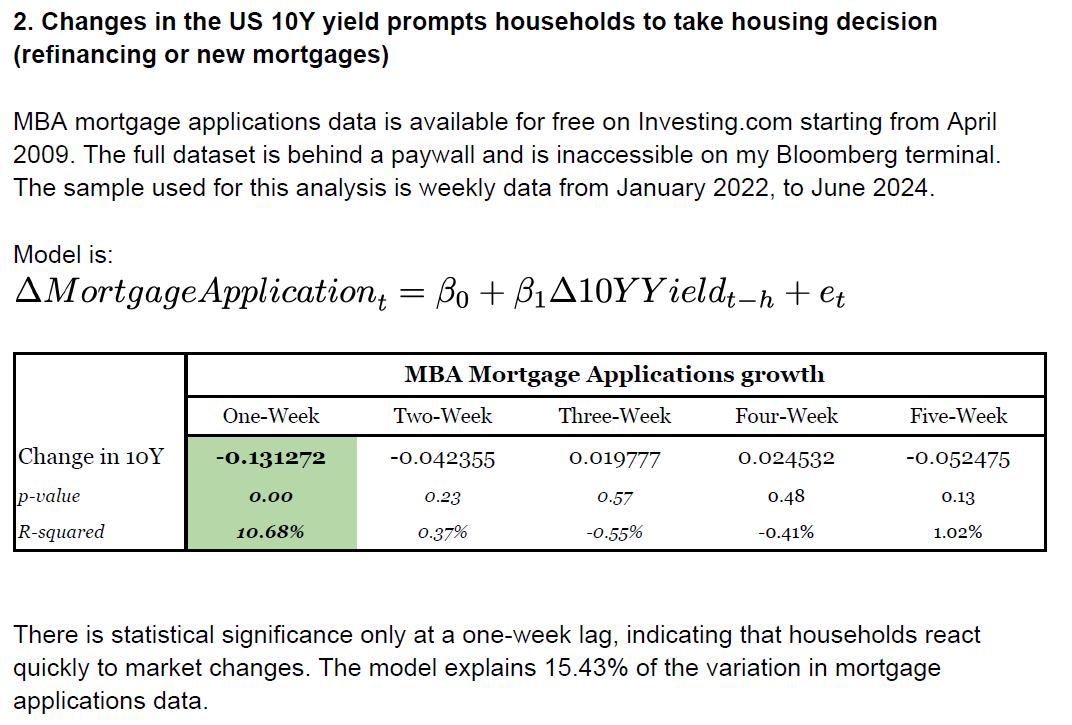
As discussed at the beginning of the note, Anmol is a Macro Musings subscriber and asked to contribute to the note. He looked at this empirically, so the below is his work which I found really interesting.
Really interesting empirical study from Anmol. My own conclusions of his findings are:
-Mortgage apps respond very quickly to changes in 10y yields. The relationship has deepened since COVID, meaning the impact is sooner and stronger. This is consistent with the case studies I provided earlier. This is heavily driven by demographics, which I covered in my note The Case for Higher for Longer Interest Rates. Baby Boomers are sitting on substantial home equity and wealth and in no rush to sell down their properties to fund retirement, while millennials are now at peak family formation phase. So if you are 40 years old, married with children, your desire for lifestyle changes takes precedence over waiting for the bottom in housing. Thus, from one month to the next, if MBS rates fall by 50-100 bps with no change to their employment situation, many millennials jump on that knowing fully well they can always refinance at a later date if rates fall further.
-SPX returns have a notable impact on consumption and GDP within 3-4 quarters. This is consistent with the consumer confidence, retail sales, and housing market indicators I provided earlier. This is entirely logical when we get large movements in the market as we have had in the last 18 months. If you turn around 3 months from now and your net worth has increased by 20%, it’s quite logical that you will go out to dinner more often, take a vacation or make a big ticket purchase that you were hesitant about.
-Most surprising is that SPX returns are not impacting investing decisions by the corporate sector. I don’t have a great explanation, but those decisions are more often made by the companies based on longer term factors. For example, the movements in equity prices would not change companies’ view of the potential for AI to be a driver of profits in the years and decades to come.
So where are we now? We’ve had softer consumption data for two months in a row, a strong jobs report but that came with a move higher in the unemployment rate by 0.1% to a psychological level of 4%, and a soft CPI. Does this mean the economy is on a self reinforced weakening path, or does the FCI loop have another episode in store for us? Remains to be seen, but let’s look at the market implications.
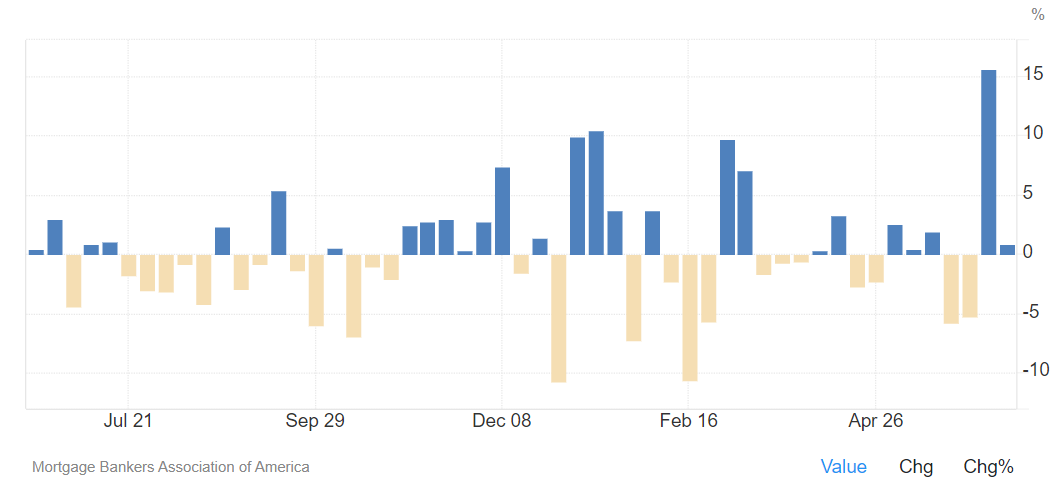
-Since the end of April, the 10y has declined by 50 bps. We saw a sharp move higher in MBS apps last week of over 15%, but no follow through this week. We will have to monitor this over the next few weeks.
-SPX has rallied since April 19th a further 11%. Based on the above analysis, we should start to see consumption pick up within a few months.
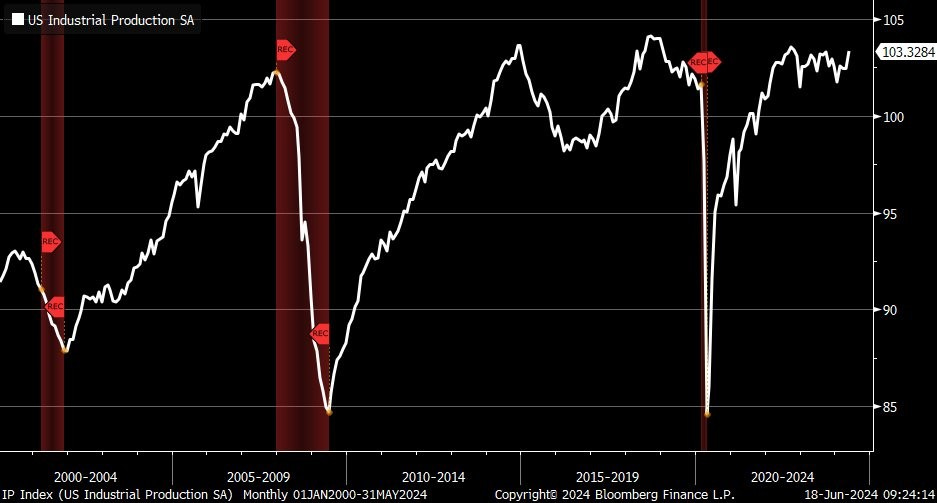
-Industrial Production rose to the highest level since 2022. If manufacturing picks up, that means the goods sector is improving. What happens to inflation if the goods sector stops deflating?
Is the job market softening, or is immigration supply causing all kinds of issues with the unemployment rate and household report? Tax Receipts are the best real-time measure of incomes, are unrevised and come from raw data directly from paychecks. They are extraordinarily strong.
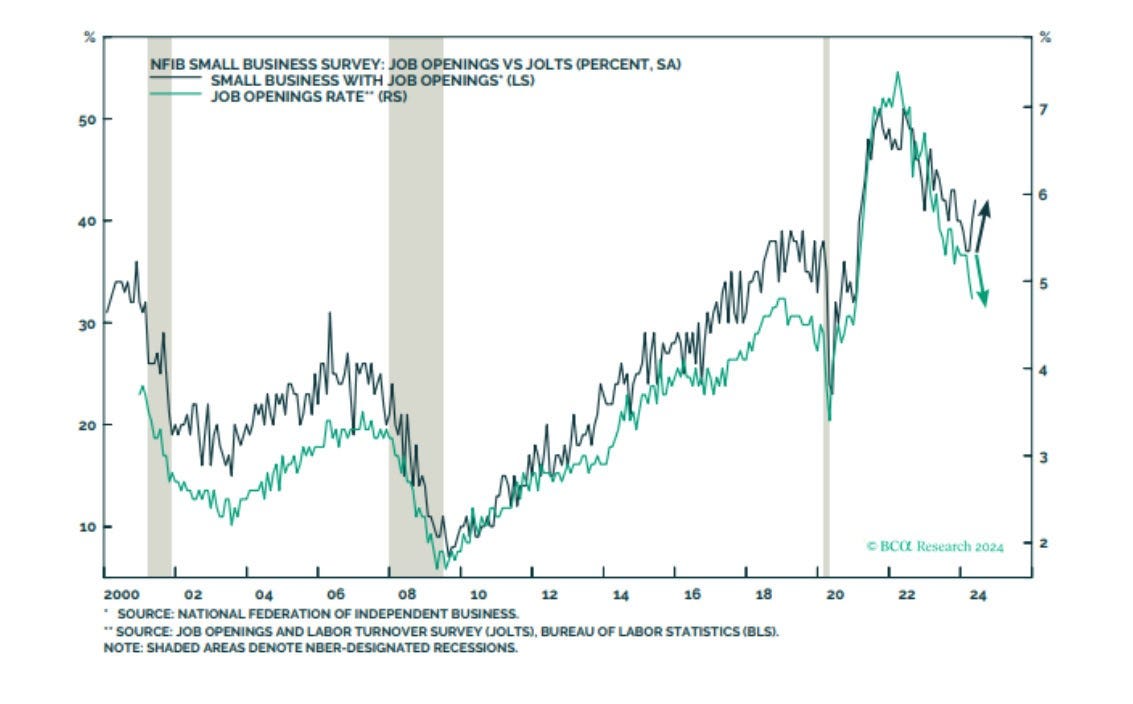
Small business surveys, while very noisy, might even indicate a potential move higher in job openings.
We will see how this resolves. If the data worsens further for the next 2-3 months, then the slowdown is material and will most likely result in rate cuts. My base case is the underlying economy is strong enough that easing FCI will prevent weakening from cascading further, and may even improve growth from here, particularly in the manufacturing sector. We will find out within 2-3 months. If I am right, policymakers will need to consider that FCI is simply too loose for them to achieve their policy goals. Being on hold for longer may be insufficient in that case, which would leave them with their only weapon left: further rate hikes to finish the job. Nobody is really prepared for that outcome in the markets.
















Thx for another insightful read, now I know why things are so loopy. Term premium tantrum favorite new phrase. Nice work Anmol
Great post, thanks. Do you have any reading/follow recommendations for people looking to understand macro better?