

I spent a part of my weekend building quant indicators for inflation before I leave for vacay this evening, so this newsletter is a full scale nerd alert zone. I ended up finding a really cool screen in Quant Insights for RV pair trades, which I will share below.
As a reminder, I entered into a partnership with QI: Quant Insight Partnership. They have a terrific platform that provides real time analytics on markets to decipher its drivers , and valuation. If you are an institutional investor who wants to improve their quant analytics, they can save you a ton of time. If you wish to learn more or get a demo, get in touch with me and I can facilitate the introduction.
Below are just a few of many interesting relationships I found while looking around their platform on the weekend.
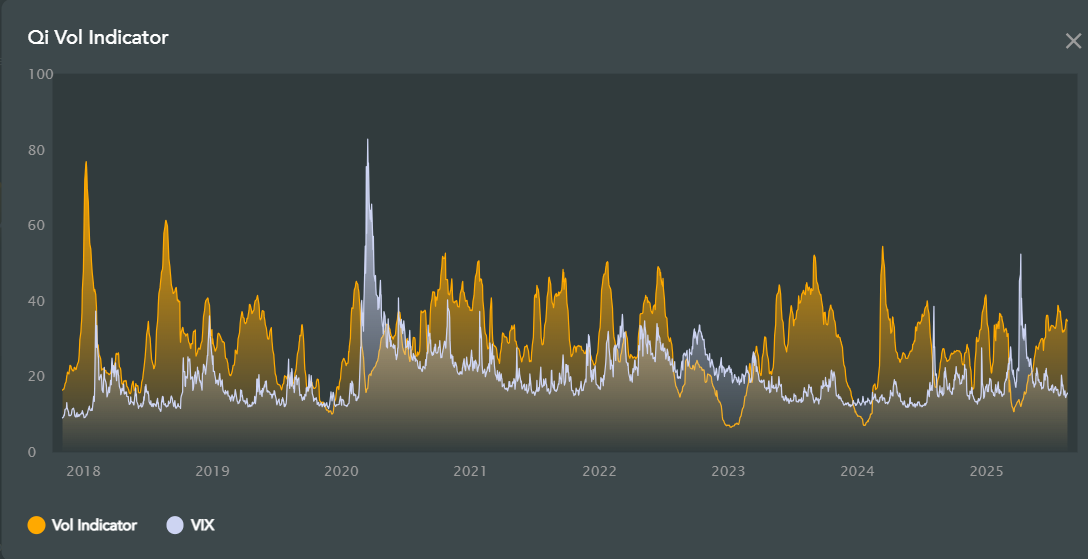
VIX Indicator typically moves up before the big VIX spikes. As noted yesterday, I am defensively positioned myself with a put fly on E-minis for Friday.
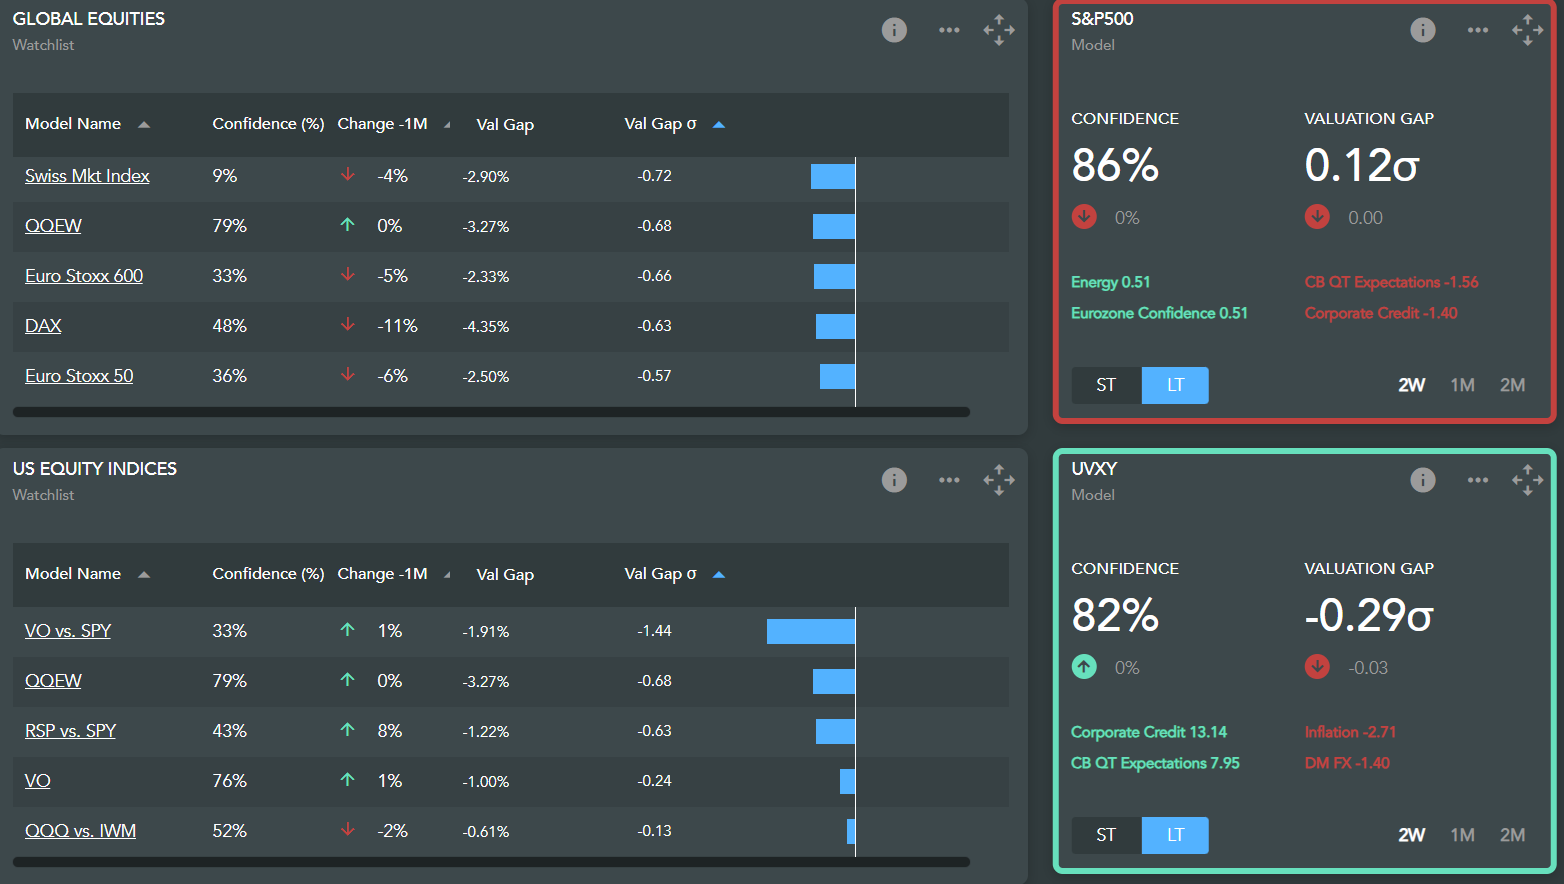
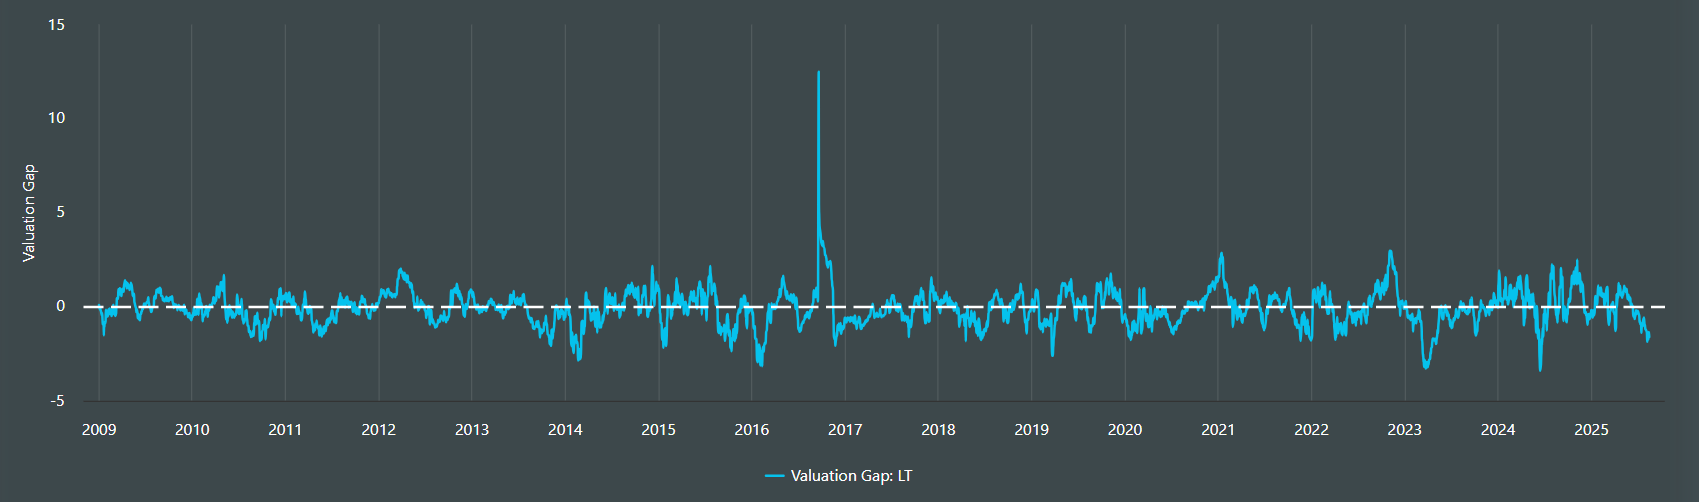
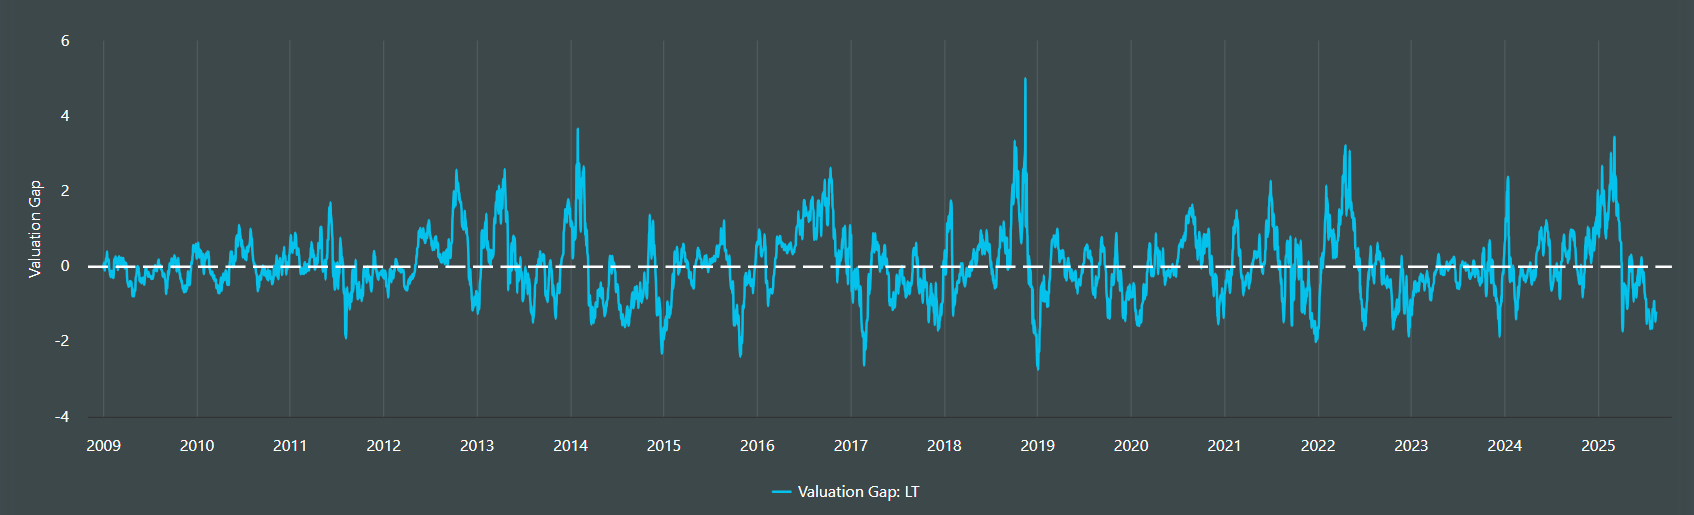
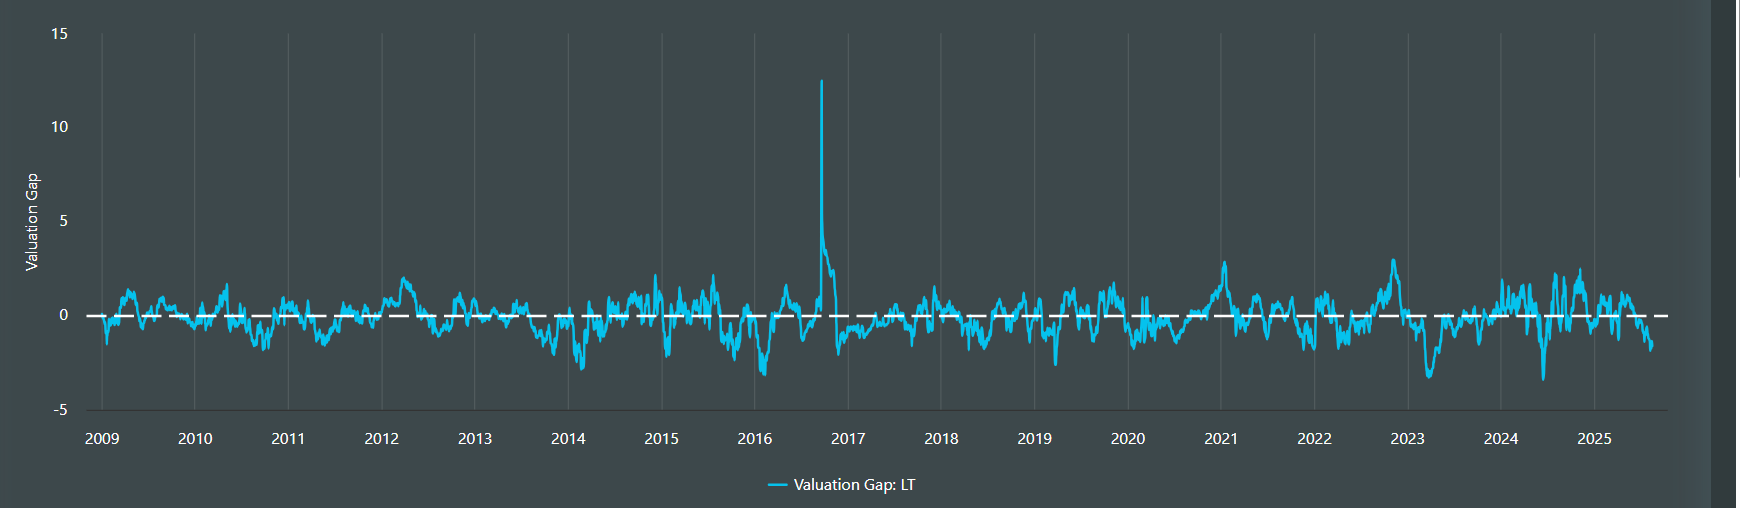
They have a cool dashboard screen that summarizes the major markets and you can quickly see any valuation gaps in their work. The screen is customizable so you can put your closely watched markets to be able to monitor them quickly. For example, a quick change in model confidence means something else is driving the market than the models capture, which is a possible regime change. Valuation gaps measure difference between their model value and spot.
Here are a few models that I found interesting.
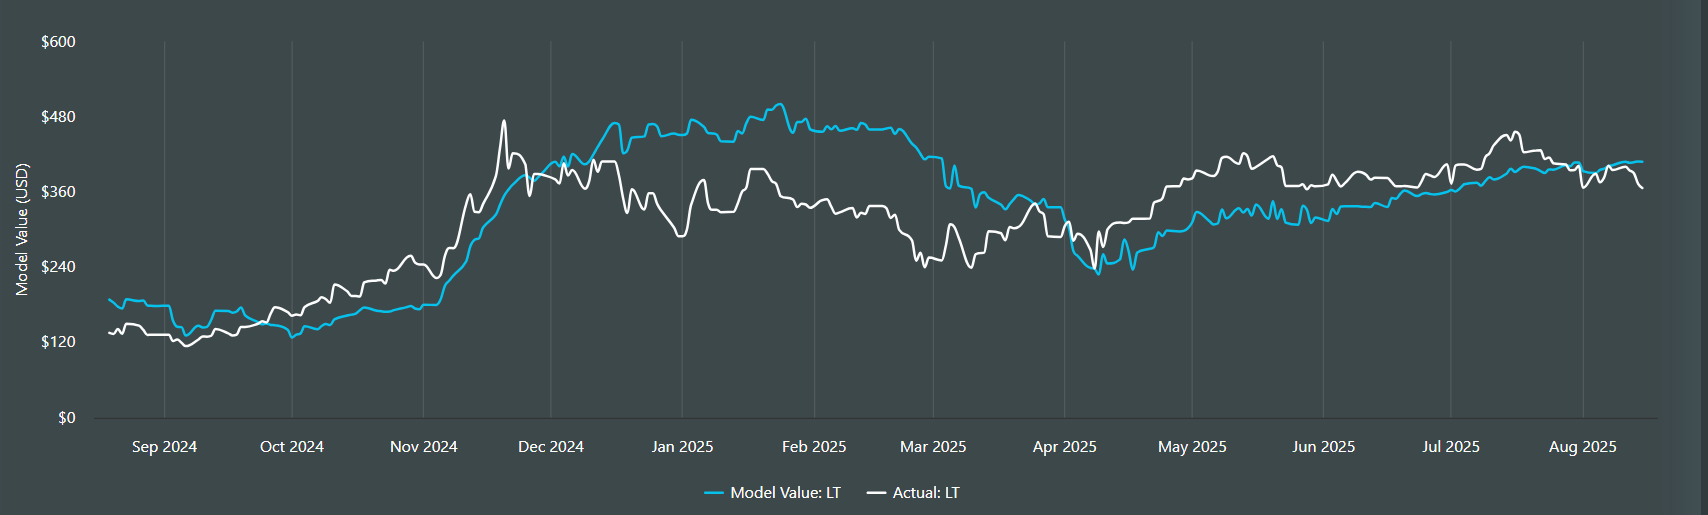
MSTR - They capture a model value based on its BTC holdings and they have it as cheap to model.
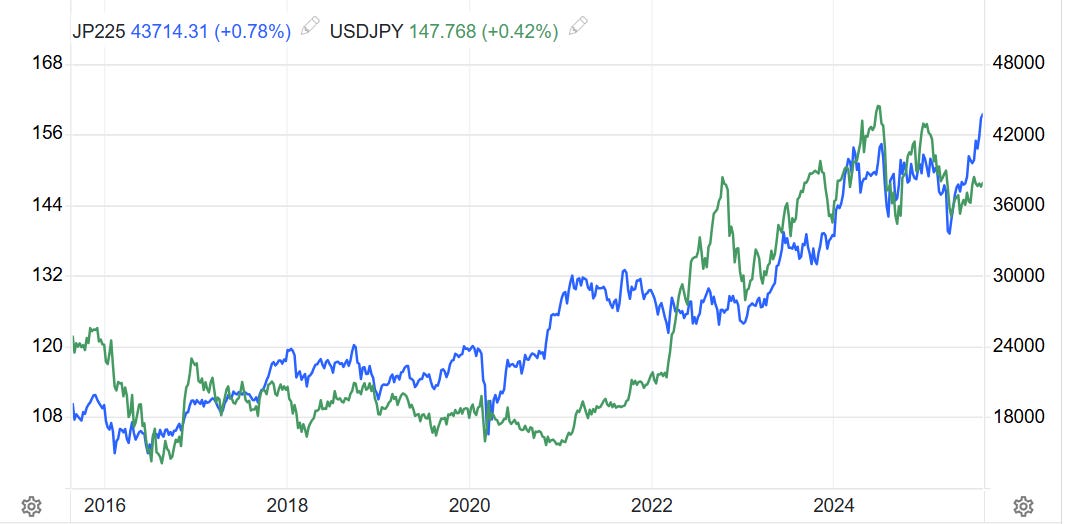
They have a model for Nikkei/SPX pair trade, and we can see clearly that the market has run much further than the model has. If you’re long NKY, it may be a good time to take profits or hedge. In my own perspective, Yen weakening has led to a rush to buy NKY as it has led to sequential improvement in GDP. However, it will mean hikes are back on the table, which means Yen could strengthen soon. NKY is already rich to where USDJPY implies. Tokyo trilemma. My note has details.
XLB vs IYR (materials vs. real estate) has already shot up well above fair value. It is 1.2 sigma rich in their models.
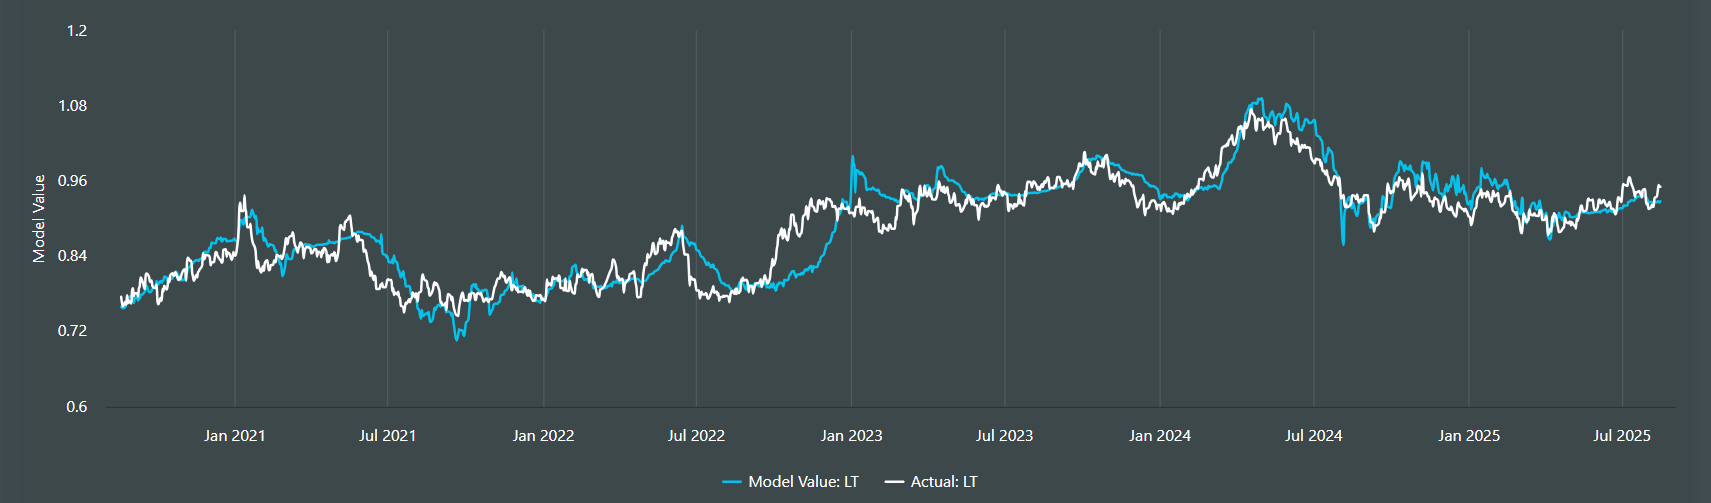
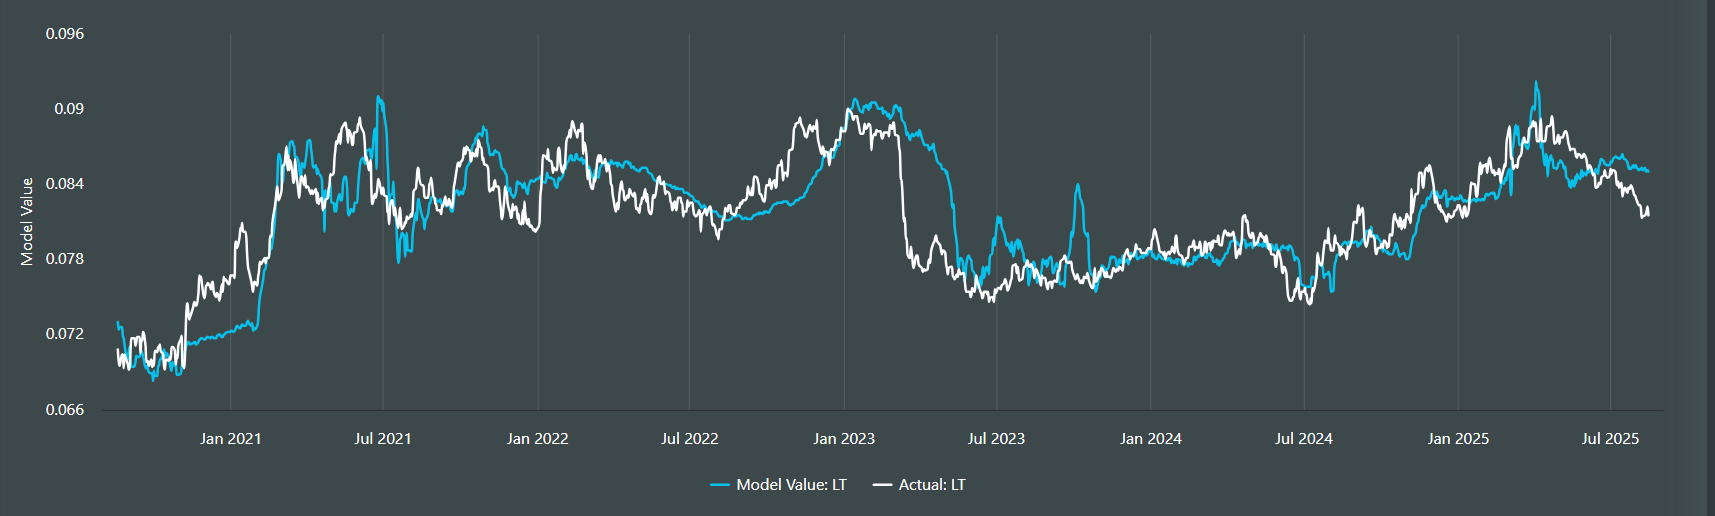
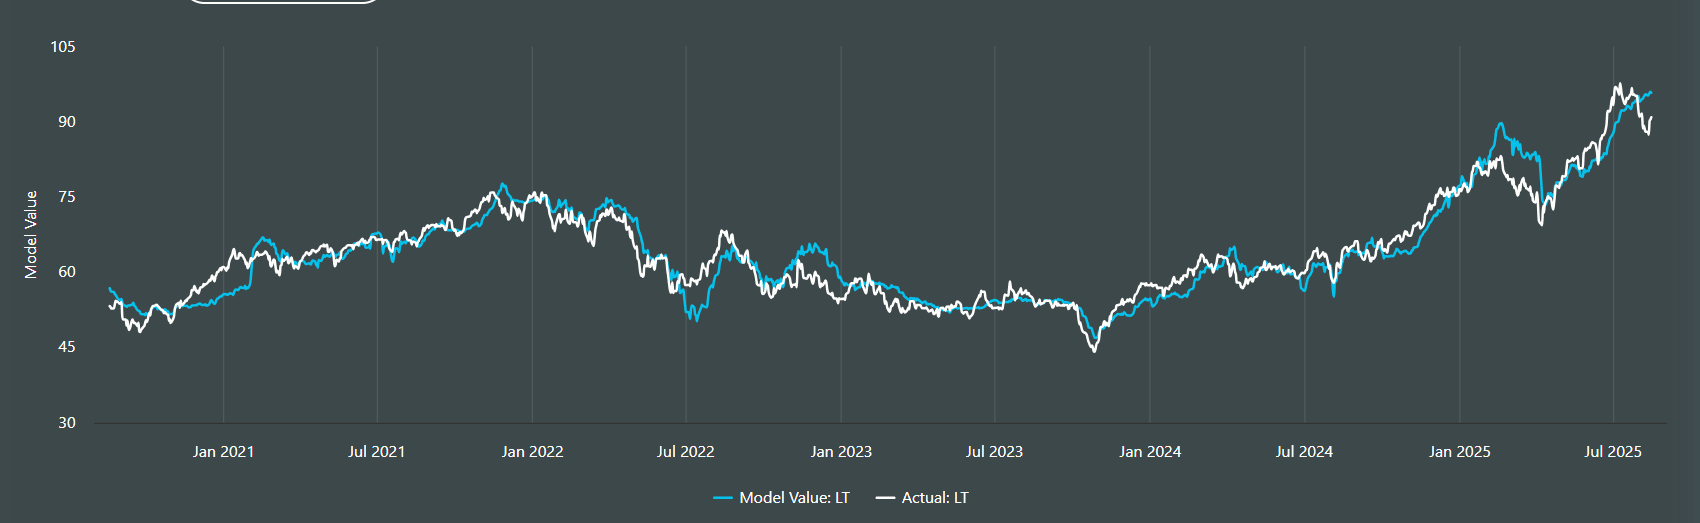
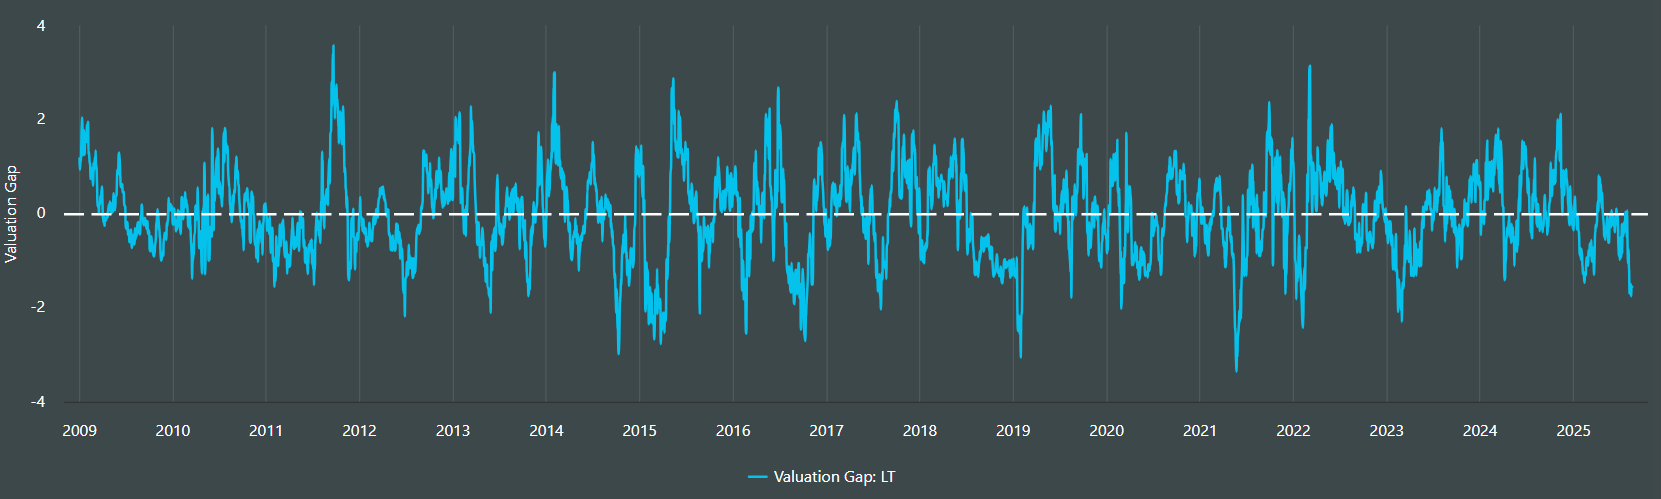
Their models suggest Gold could richen vs. Bonds (GLD vs TLT). Can clearly see how close the model has tracked the last 5 years and is now showing this as an undervalued pair.
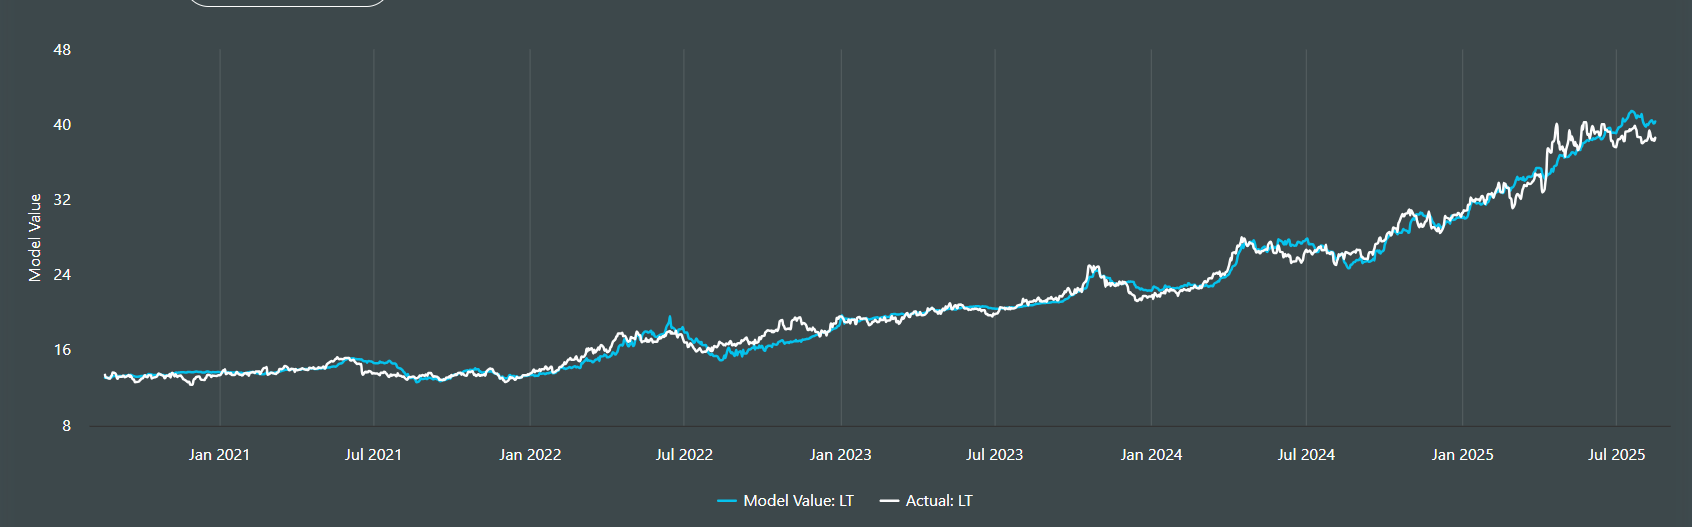
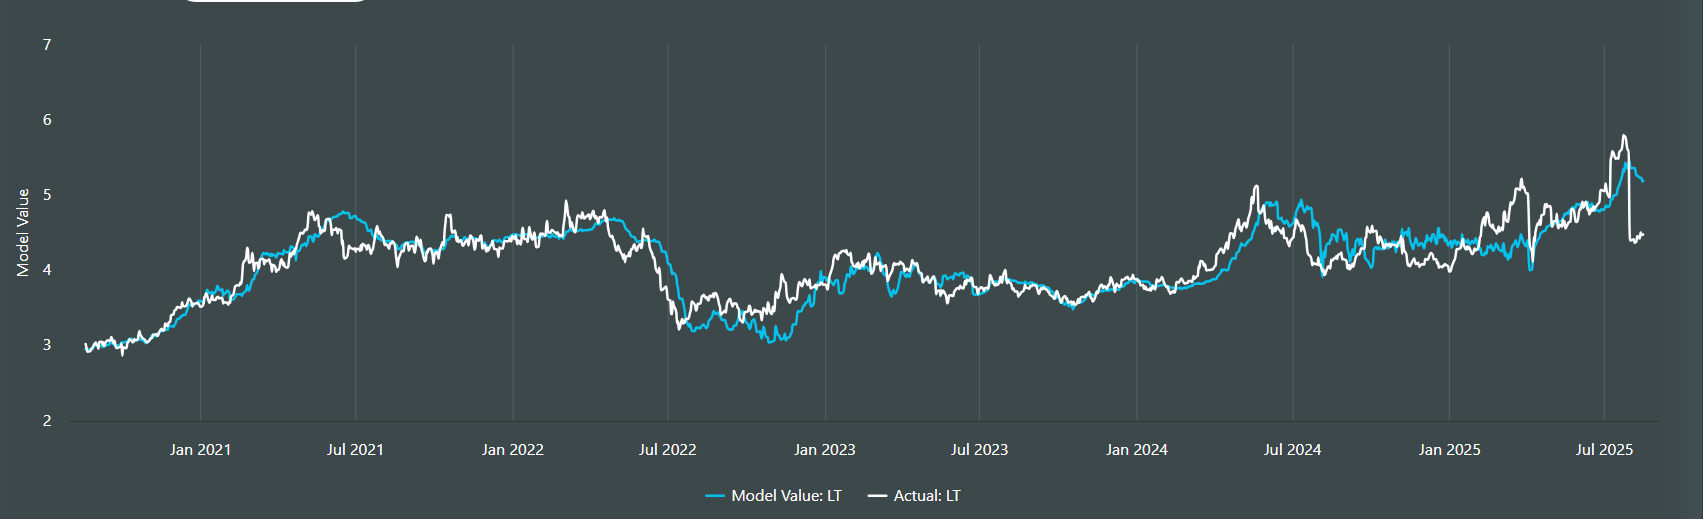
They see copper as materially below fair value, which makes sense as it has been driven by tariff headlines not fundamentals. This is one of the largest valuation discounts they have ever had. They see 5.20 as fair value.
They have crude as $3 too cheap.
They see UNG, Nat Gas fund, as 1.2 sigma too cheap which is a fairly large valuation discount.
They see the recent underperformance of XLF vs SPY as unwarranted in their models. This is also a fairly large valuation discount on the pair trade at 1.6 sigma.
They see EIS (Israel) as cheap to their models. I agree with them and bought back in last week after it corrected from overbought conditions.
If you think optimism over a Ukraine deal is too high and wish to fade it, EURHUF looks like a long. HUF is a beneficiary of the war ending just as PLN is and they have outperformed EUR. This is a 1.55 sigma valuation discount in their models.
These are just the ones that I found interesting, but they have hundreds more. They also have customizable tools to generate your own watchlists and they can work with you to assess the quantifiable drivers of the securities you are invested in. This can be very valuable in spotting regime changes or valuation gaps in real time.
I highly recommend their platform. Get in touch if interested in learning more.